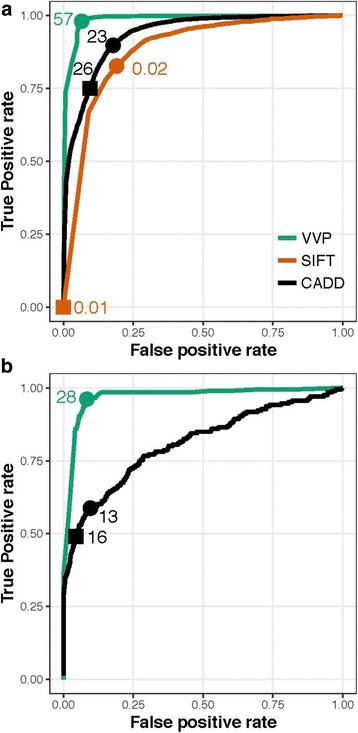
Fig. 2.

ROC analyses for ClinVar. a Coding Variants. b Non-coding variants. The points on the curves labeled with circles correspond to score thresholds resulting in each tool’s maximum accuracy. That score is shown beside the circle. Points denoted with squares correspond to the score threshold for SIFT and CADD required to reproduce VVP’s call rate for damaging variants on the NA12878 WGS. See Discussion and Table-3 for details. VVP was run using its default dominant model, whereby every variant is scored as a heterozygote. No data are shown for SIFT in panel B, as it does not score non-coding variants
