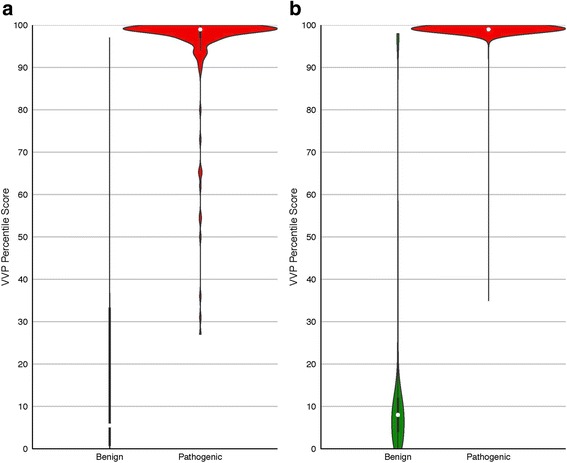
Fig. 5.

VVP percentile scores for ClinVar CFTR and BRCA2 variants. Violin and box plots are described in Fig. 4. Percentile Scores are shown on the y-axis; benign variants on the left, pathogenic on the right. a CFTR. Pathogenic: 897 variants, mean score: 100. Benign: 466 variants, mean score: 17. b BRCA2. Pathogenic: 249 variants, mean score: 93. Benign: 6 variants, mean score: 34. All scores were generated without using genotype information, i.e. the variant was scored as a heterozygote
