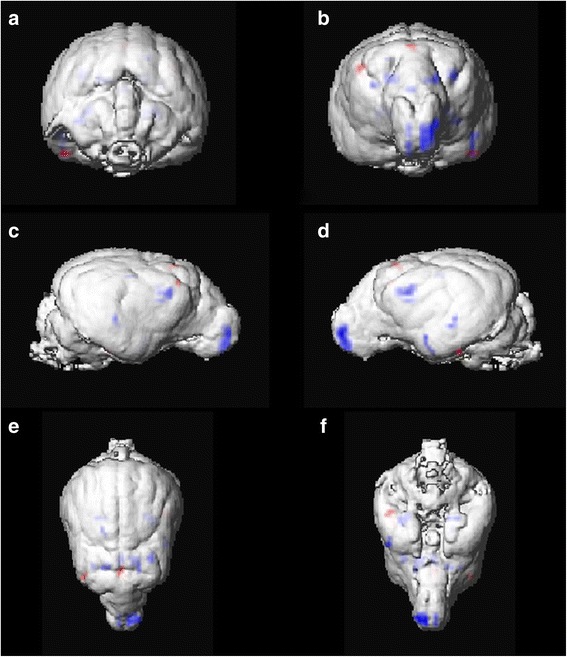
Fig. 3.

Results of VBM analysis 1 (control vs. IE Beagle group) using SPM12 illustrated on surface rendering of mean extracted GM images of control Beagles. Statistically significant reduced (blue) and increased (red) GMV is displayed in caudal [a], rostral [b], lateral right [c] and left side [d], dorsal [e] and ventral [f] views (VBM: voxel-based morphometry, IE: idiopathic epilepsy, GM: grey matter, GMV: grey matter volume)
