
Fig. 4.
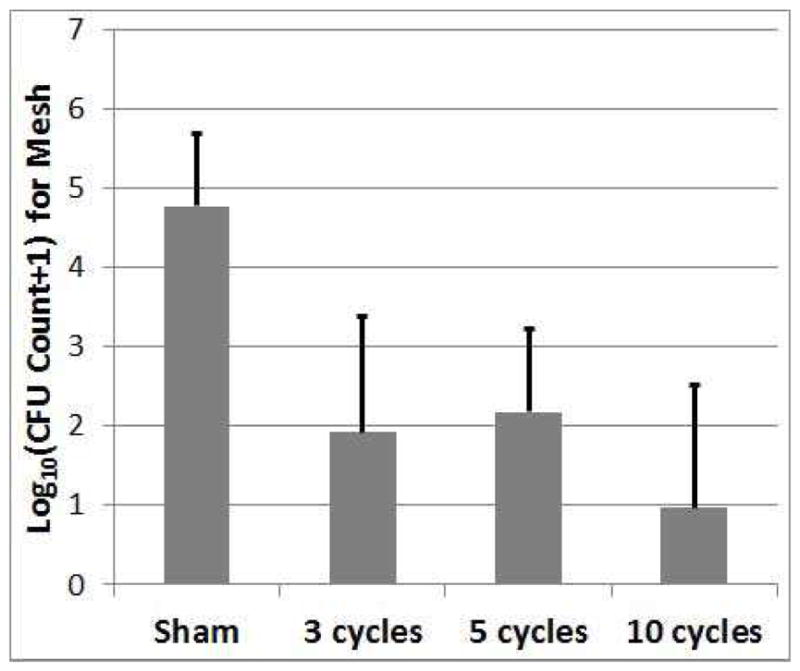
Count of CFUs surviving on the mesh sample following the treatment as a function of the number of cycles in the tone burst used to treat the biofilm on the mesh. The error bars correspond to one standard deviation.
Official websites use .gov
A
.gov website belongs to an official
government organization in the United States.
Secure .gov websites use HTTPS
A lock (
) or https:// means you've safely
connected to the .gov website. Share sensitive
information only on official, secure websites.
Count of CFUs surviving on the mesh sample following the treatment as a function of the number of cycles in the tone burst used to treat the biofilm on the mesh. The error bars correspond to one standard deviation.