
Figure 3. Dopamine responses reflect both stimulus difficulty and choice.
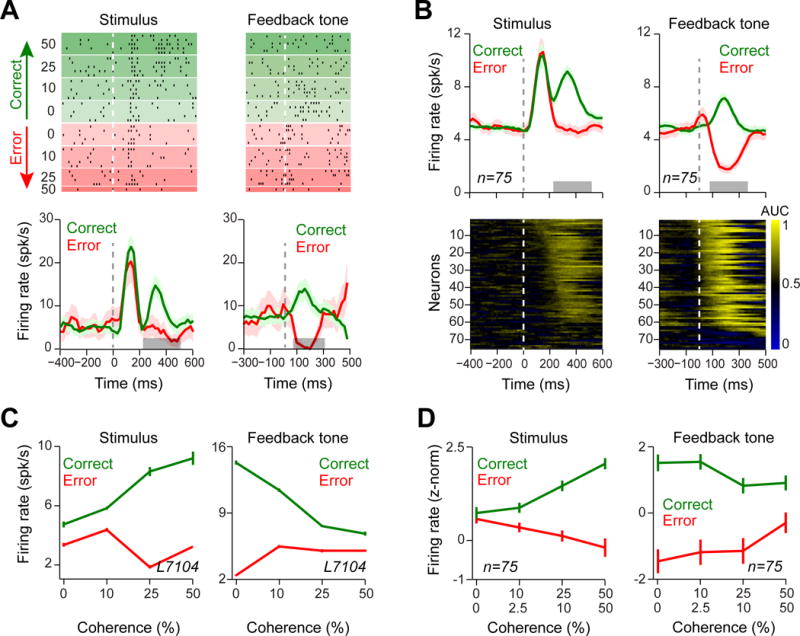
(A) Top panels: Raster plots of an example dopamine neuron aligned to stimulus onset and feedback tone onset, which indicated the trial outcome (correct or error). For error trials of low stimulus coherence and all correct trials, only a fraction of trials (randomly selected) is shown. Bottom panels: pre-stimulus time histograms (PSTHs) of the example neuron aligned to different task events. In the PSTHs, trials with different stimulus difficulties were collapsed. Horizontal gray bars indicate temporal windows used for analyses in (C). For illustration purposes, in all figures, we treat stimuli of equal coherence together, regardless of motion direction. To isolate the effect of decision confidence on neuronal responses, only trials in which the monkey made a saccade to the large-reward side were included in all panels of this figure. See Figure S3 for neuronal responses to the fixation cue. Unless otherwise stated, in all figures error bars are s.e.m. across trials or neurons (for single neuron examples and population, respectively).
(B) Top panels: PSTHs of dopamine population (averaged across 75 neurons recorded in two monkeys) aligned to different task events. Trials with different stimulus difficulties were collapsed. Horizontal gray bars indicate temporal windows used for analyses in (D). Bottom panels: Running area under ROC curve (AUC) for each neuron aligned to different events (see Experimental Procedures). The AUCs significantly larger than 0.5 indicate larger dopamine responses in correct trial compared to the error trials. For illustration, AUCs in each panel are sorted based on the time of the first of three consecutive significant analysis time steps (P < 0.001).
(C) The average responses of the example dopamine neuron at the time of stimulus and feedback tone. These neuronal responses resembled the DPE of the TDRL model shown in Figure 1C and D.
(D) The population dopamine responses at the time of stimulus and feedback tone. These neuronal responses resembled the DPE of the TDRL model shown in Figure 1c and d and differed markedly from prediction errors of the alternative TDRL model shown in Figure 1F and G. See also Figure S3.