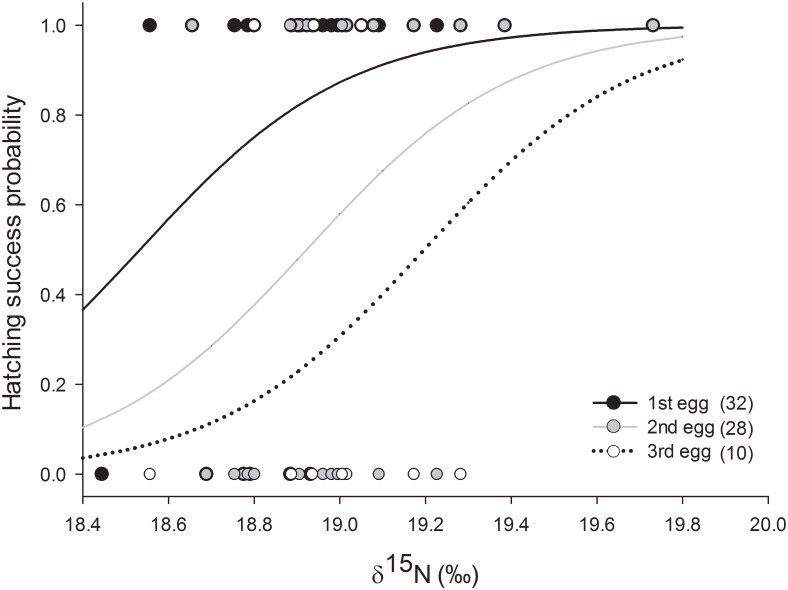
Fig 3. Relationship between δ15N values measured in female blue-footed booby (Sula nebouxii) whole blood during the incubation period and hatching success (sample sizes in parentheses, data and estimated probability).
Fitted lines (black, grey and dotted) are derived in GLM models and represents the laying order (1–3).

