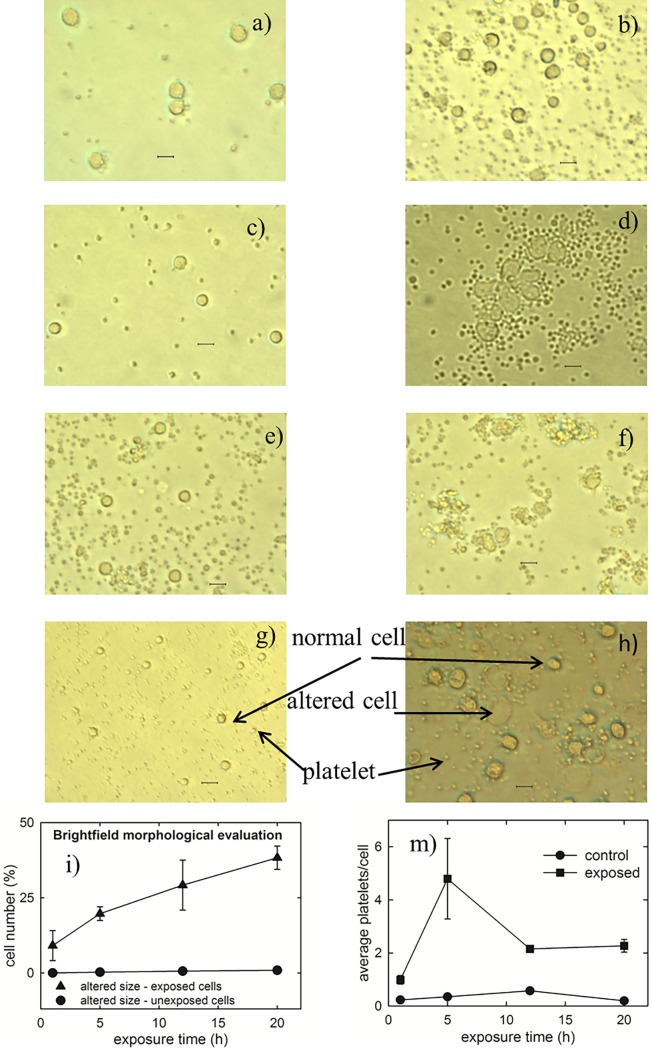
Fig 1. Optical images of control and exposed cells to EMFs at 1.8 GHz.
Bright field optical images of controls (a, c, e, g) and respective 1 h, 5 h, 12 h and 20 h exposed (b, d, f, h) samples to the electric field strength of 200 V/m of microwave of 1.8 Ghz. The larger structures correspond to adherent PBLM cells, whereas the smaller ones are platelets which cannot be completely separated by the density gradient procedure to isolate PBLM cells. The scale bar corresponds to 15 μm. The images are representative of 3–4 independent experiments (i.e. biological replicates corresponding to samples from different donors for each condition), yielding comparable results. The plots at the bottom shows the percentage of cells whose size appeared altered after 1, 5, 12 and 20 h exposure (i) and the average number of platelets stuck on each single cell as a function of exposure time (m). For each sample, about 300 cells were analyzed from 20–30 randomly selected optical fields. The bar values are means ± SEM of 3–4 independent experiments.

