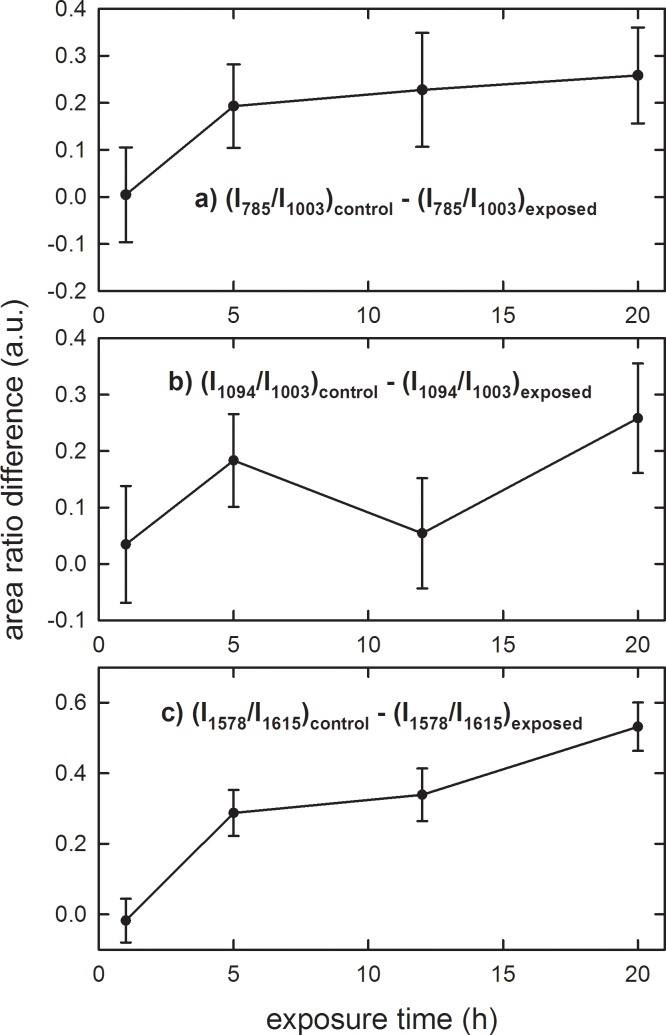
Fig 4. Area ratios of Raman peaks from spectra of control and exposed PBLM cells to EMFs at 1.8 GHz.
Difference of I785/I1003 (a), I1092/I1003 (b) and I1578/I1615 (c) area ratios of Raman peaks of the control with respect to the exposed lympho-monocyte samples for different exposure time of Fig 3. The values are means ± SEM of 3–4 independent experiments (i.e. biological replicates corresponding to samples from different donors for each condition).

