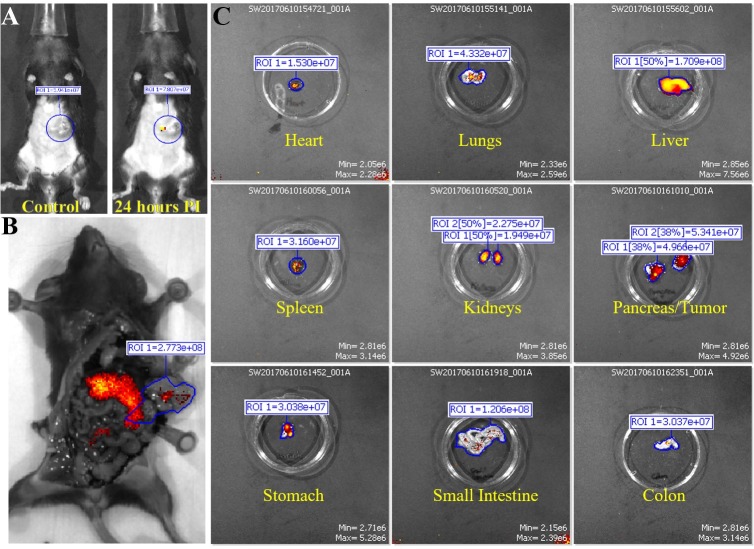
Fig 3. Fluorescent IVIS images of organs from mouse in control group 4.
Representative images for tumor bearing mice injected wutg mouse IgG1 isotype control are shown. (A) Fluorescent IVIS image of before (control) and 24 hours post injection of IgG1 conjugated with ICG. 24 hours PI fluorescence is normalized to its own control fluorescence. (B) The mouse is imaged with filter pair ICG on the IVIS Spectrum. Background has been removed and the ROI measurements for the tumor is shown. (C) Organs from mouse are imaged individually in the IVIS Spectrum. Intensity of the red-yellow fluorescence in ROI measurements indicate background and antibody accumulation for each organ.

