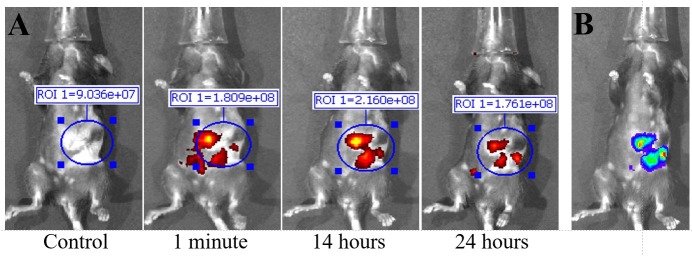
Fig 4. Fluorescent IVIS images taken at different time points of mouse injected with murine monoclonal TAB004.
Representative images are shown. (A) Fluorescent IVIS image with filter pair ICG of before (control) 1 minutes, 14 hours, and 24 hours post injection of Parental TAB004 with ICG. Fluorescence images taken after injection are normalized to their own control fluorescence. Background has been removed and the ROI measurements for antibody fluorescence are shown. Intensity of the red-yellow fluorescence in ROI measurements indicates background and antibody accumulation. (B) Bioluminescent image of orthotopic tumor in same mouse.

