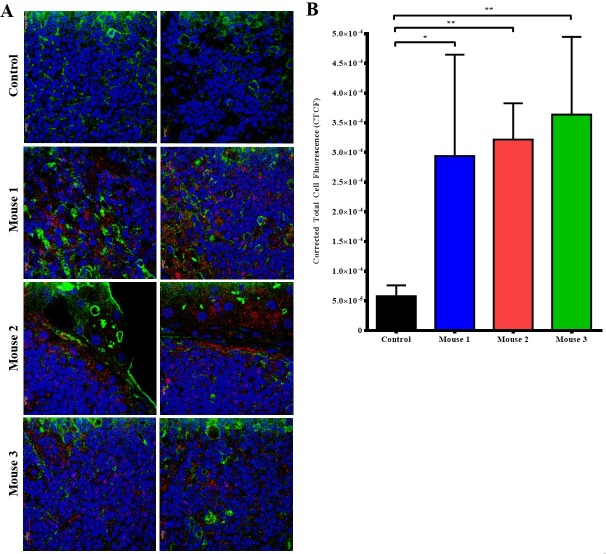
Fig 8. Confocal imaging of tumor sections from Chimeric TAB004 injected mice.
Representative images shown. (A)Tumor sections from Chimeric TAB004 injected mice were sectioned into slides imaged. Blue = nucleus (DAPI), Green = cell membrane (Alexa Fluor 488), Red = Chimeric TAB004-ICG. (B) Quantification of fluorescent signal from Chimeric TAB004-ICG using Image J. Data shown is mean ±SEM (n = 3) and determine by unpaired t-test.*p<0.05,**p<0.01.

