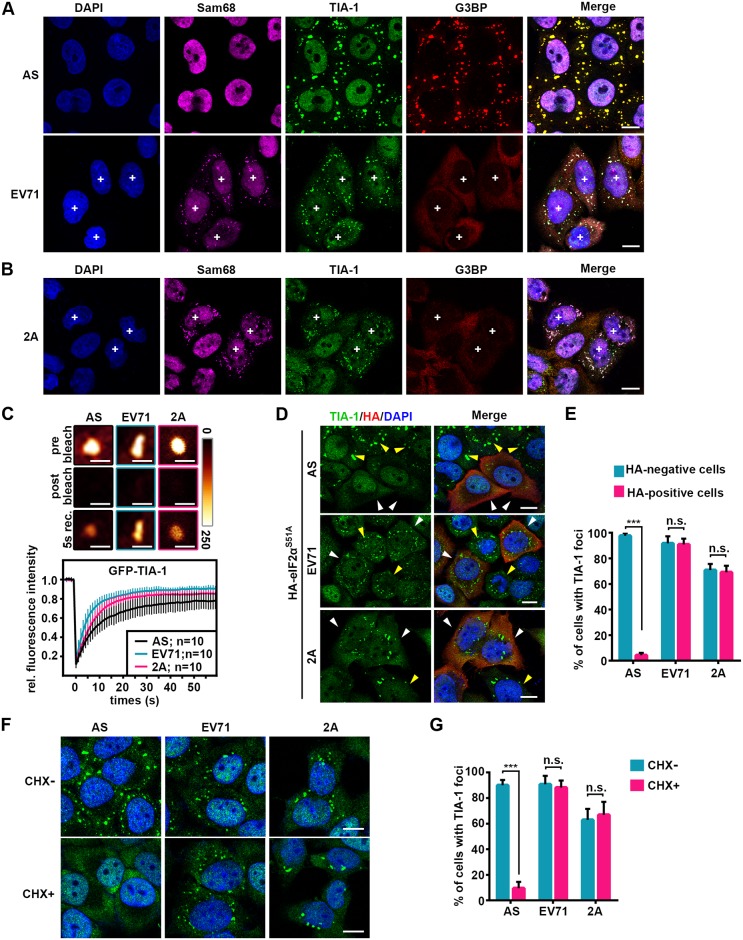
Fig 1. 2A-induced stable TIA-1 foci are aSGs.
(A-B) The location of Sam68, TIA-1, and G3BP in AS-treated (200 μM, 1 h), EV71-infected (MOI = 10, 5 hpi) (A) or 2A-expressing (24 hpt) (B) HeLa cells. “+” indicates EV71-infected or 2A-expressing cells. (C) Dynamics of TIA-1 in AS-, EV71-, or 2A-induced foci. FRAP assays were used to evaluate the averaged recovery of GFP-TIA-1 in the indicated foci. Representative images of fluorescence intensities observed in foci at indicated times during FRAP assays are shown in pseudo-colors (glowdark) in the top panels. (D) Effects of eIF2α phosphorylation on TIA-1 foci. Following transfection with HA-eIF2αS51A for 24 h, HeLa cells were treated with AS, infected with EV71 for 5 h, or transfected with 2A for 24 h and then fixed and stained as indicated. White and yellow arrows show the comparison of TIA-1 foci assembly in the presence and absence of eIF2αS51A. (E) Quantitative analysis of the cells (in D) with TIA-1 foci among HA-positive or HA-negative cells. n = 3, 240 cells/condition were counted, mean±SD; n.s., no statistical significance, ***p<0.001. (F) CHX effects on TIA-1 foci. HeLa cells were treated with AS (0.5 h), EV71 (5 h), or 2A (24 h), with or without CHX for 1 h (CHX+ or CHX-) and then fixed and stained with TIA-1(green) and DAPI (blue). (G) Quantitative analysis of cells with TIA-1 foci in F. n = 3, 240 cells/condition were counted, mean±SD; n.s., no statistical significance, ***p<0.001. Scale bars in B, 2 μm; scale bars in others, 10 μm. See also S1 and S2 Figs.

