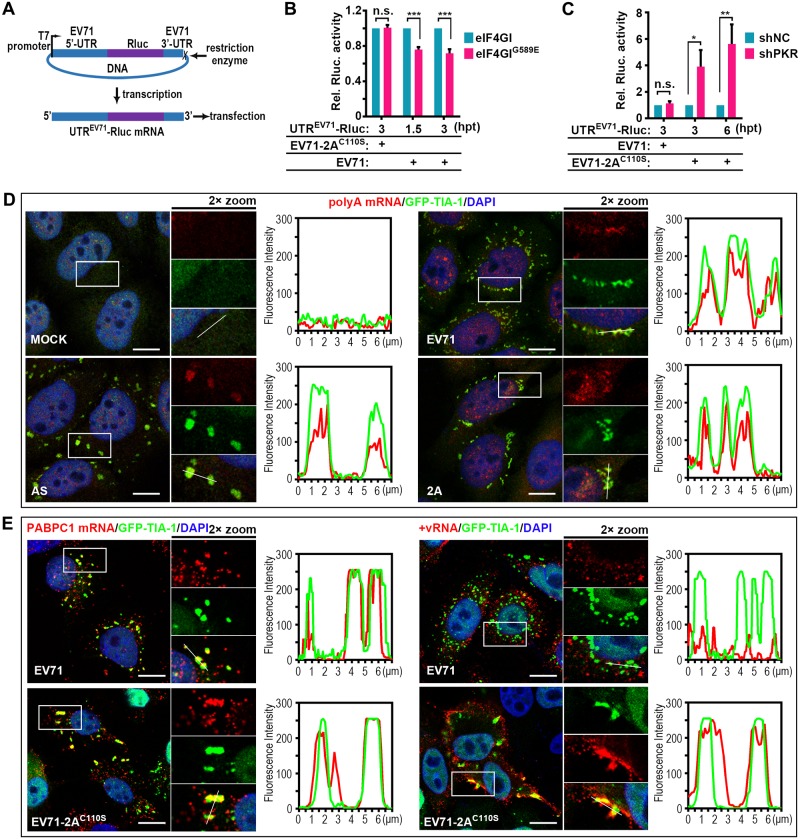
Fig 7. 2A induces aSGs to stall host mRNAs and release viral mRNAs.
(A-C) Effects of EV71-induced aSGs and EV71C110S-induced tSGs on viral translation. Graphic description of EV71-UTR driven Renilla luciferase reporter expression (A) and reporter assays in HeLa cells (B and C). Cells were infected with EV71 for 3h to induce aSG formation or infected with EV71-2AC110S for 6h to induce tSG formation before transfection with UTREV71-Rluc mRNAs, and the luciferase activity was measured at indicated time post-transfection. The EV71-2AC110S-infected eIF4GI/eIF4GIG689E-HA-HeLa cells and EV71-infected shNC/shPKR-HeLa cells were negative controls. n = 3, mean±SD, n.s., no statistical significance; *p<0.05; **p<0.01; ***p<0.001. (D) FISH assays of total polyA mRNA colocalized to TIA-1 foci in GFP-TIA-1-HeLa cells after mock treatment or treatment with AS, EV71, or 2A. GFP-TIA-1 (green), polyA mRNAs (red), and nuclei (blue) are shown. The fluorescence intensity profile of GFP-TIA-1 (green) and polyA mRNA (red) was measured along the line drawn on a 2× zoom panel by Leica Application Suite Advanced Fluorescence Lite. (E) FISH assays of GFP-TIA-1-HeLa cells infected with EV71 or EV71-2AC110S. PABPC1 mRNA (left panel) and EV71 mRNA (+vRNA; right panel) were monitored. The fluorescence intensity profile of GFP-TIA-1 (green) and +vRNA/PABPC1 mRNA (red) was measured along the line drawn on a 2× zoom panel by Leica Application Suite Advanced Fluorescence Lite. Scale bars, 10 μm. See also S7 Fig.

