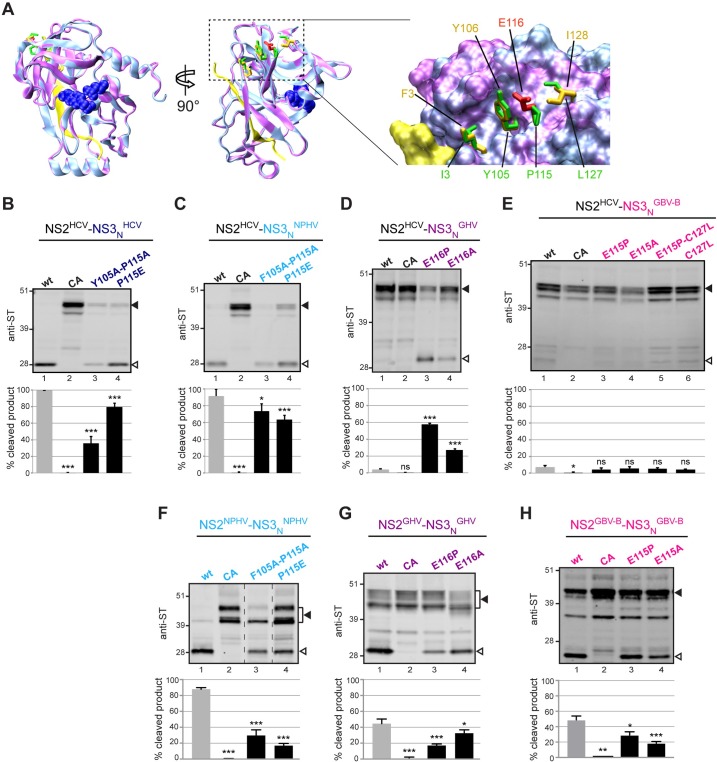
Fig 6. Importance of hydrophobic surface residues in NS3N for HCV NS2 protease activation by heterologous hepacivirus NS3N.
(A) Superposition of the backbone ribbon structures of GHV NS3N (colored magenta) with HCV JFH1 NS3N (colored cyan) homology models, established by using the crystal structures of HCV NS3 of genotype 1b as template (for details, see Materials and Methods). In the two images at the left (rotated by 90° one with respect to the other), the side-chain atoms of NS3 protease catalytic-triad residues (His 57, Asp 81, and Ser 139/140) are represented as blue spheres of the corresponding van der Waals radii for both models, and NS4A cofactors are represented in yellow. Residues I3, Y105, P115 and L127 in HCV (stick representation, colored green) are shown comparatively to the homologous residues F3, Y106, E116 and I128 (colored orange or red) in GHV. These surface residues are highlighted in the enlargement of NS3N surface patch shown at the right. (B-E) HCV NS2-NS3N-ST precursors with either native (wt) or mutated (CA) NS2 catalytic triads and HCV NS2-NS3N-ST precursors containing the indicated substitutions at residues 105 and/or 115 of NS3N were expressed in cells (B). Chimeric NS2HCV-NS3Nhepaci-ST precursors in which NS2 was derived from HCV and NS3N was derived from NPHV (C), GHV (D), or GBV-B (E) and contained the indicated substitutions at residues 105, 115, and/or 127 were expressed in cells. Chimeric NS2HCV-NS3Nhepaci-ST controls harbored native (wt) or mutated (CA) HCV NS2 catalytic triads. (F-G) Hepacivirus NS2-NS3N-ST precursors derived from NPHV (F), GHV (G), or GBV-B (H) with either native (wt) or mutated (CA) NS2 catalytic triads and precursors containing the indicated substitutions at residues 105 and/or 115/116 of NS3N were expressed in cells. Transfected cell extracts were probed with anti-ST antibodies. Uncleaved precursors and cleaved products are indicated by closed and open arrowheads, respectively. Dotted lines indicate where lanes originating from the same immunoblot image have been brought together. Quantifications of cleavage rates (% cleaved products over ST-reactive precursors + cleaved products) were performed on 2–5 independent extracts subjected to infrared fluorescent immunoblot imaging and are plotted below representative blot images. Stars above bars represent T test statistical analyses with respect to respective wt controls and are coded as follows: * p<0.01, ** p<0.001, *** p<0.0001, ns: non significant.

