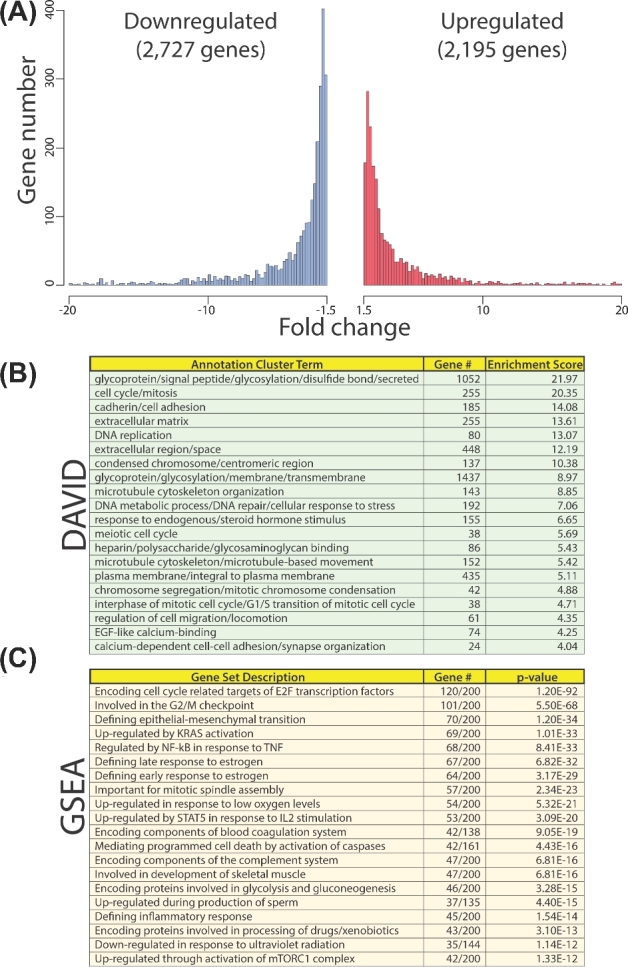
Figure 2.

Global gene expression changes during HESC decidualization. (A) Histogram of the number of genes up- and downregulated (red and blue, respectively) during decidualization (NT siRNA day 3 (EPC) vs NT siRNA day 0 (EPC)) with corresponding fold changes. (B) DAVID analysis of gene expression changes during decidualization (as shown in (A)). (C) GSEA of gene expression changes during decidualization (as shown in (A)). Enrichment of genes was surveyed against collection H (the hallmark gene sets collection representing “well-defined biological states or processes”).
