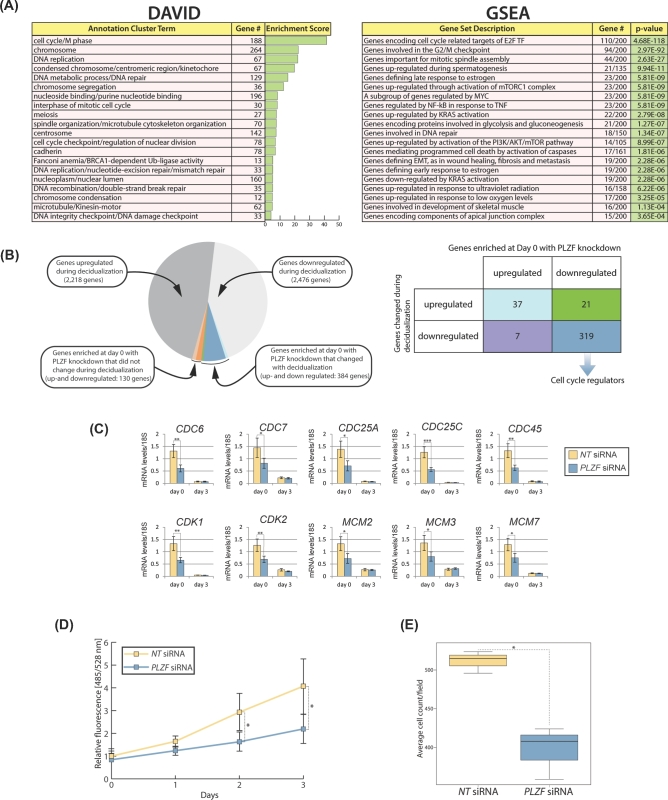
Figure 6.
Cell cycle progression in HESCs is dependent on PLZF prior to EPC treatment. (A) DAVID analysis and GSEA of genes for which transcript levels significantly changed |FC| ≥ 1.5 with a false discovery rate (FDR) < 0.05 following PLZF knockdown at day 0 EPC treatment. (B) Pie chart shows the number of genes in the indicated datasets and the overlaps between the following datasets: (1) transcriptional changes occurring during decidualization and (2) transcriptional changes that have been enriched by DAVID’s Functional Annotation Clustering at day 0 of decidualization with PLZF knockdown (as described in (A) above). The 384 overlapping genes are further described in the accompanying table. The majority of overlapping genes which are downregulated in both datasets are involved in the regulation of cell cycle progression. (C) Quantitative PCR confirms the significant downregulation in the expression levels of numerous cell cycle regulators following PLZF knockdown at day 0 of EPC treatment. (D) Reduction in HESC proliferation following PLZF knockdown as measured with a DNA content-based cell proliferation assay. (E) Knockdown of PLZF expression in HESC results in a significant reduction in cell migration as measured by a transwell migration assay.

