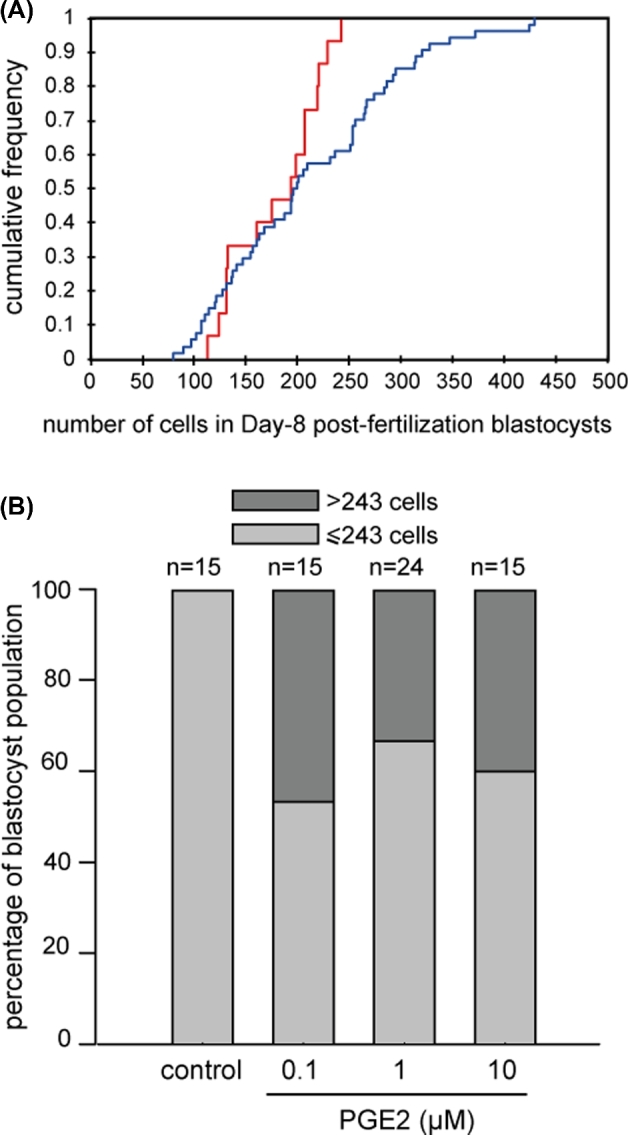
Figure 1.

Assessment of total cell numbers in bovine day 8 postfertilization blastocysts. Cumulative frequency distribution of the number of cells in blastocysts derived from the control (red line) and PGE2-treated MIV/FIV (0.1, 1. 10 μM PGE2 all together, blue line) groups (P < 0.05) (A). Distribution of day 8 postfertilization blastocysts derived from IVM/IVF cultures supplemented with increasing doses of PGE2, 243 cells being the maximum blastomere number counted in control embryos (P < 0.05) (B).
