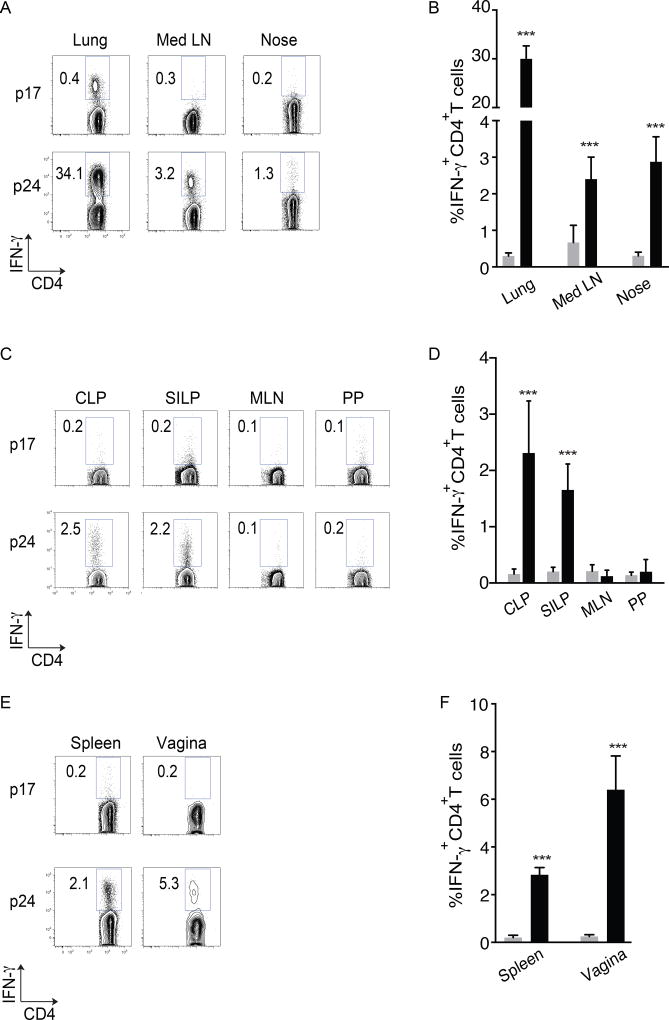
Figure 2. Following intranasal immunization, p24 immune responses are generated within nasal and lung tissues and disseminate to mucosal and systemic sites.
(A – F) C57Bl/6 mice were vaccinated i.n. with α-CD205-p24 fusion mAb (5µg) and poly ICLC (50µg) and p24-specific immune responses were evaluated one week post boost.
(A) FACS plots from a representative experiment, illustrating the induction of IFN-γ+CD4+ cells in the lung, mediastinal LN (Med LN) and nose.
(B) Mean data from three independent experiments (5 mice per group). Statistical comparisons to p17 (control) are shown.
(C) FACS plots from a representative experiment, illustrating the induction of IFN-γ+CD4+ cells in the GI effector (CLP and SILP) and inductive (Peyer’s patch- PP and mesenteric LN- MLN) sites.
(D) Mean data from three independent experiments (5 mice per group). Statistical comparisons to p17 (control) are shown.
(E) FACS plots from a representative experiment, illustrating the induction of IFN-γ+CD4+ cells in the spleen and vaginal mucosa.
(F) Mean data from three independent experiments (5 mice per group). Statistical comparisons to p17 (control) are shown.
Error bars show mean ± SD. ***=p<0.001

