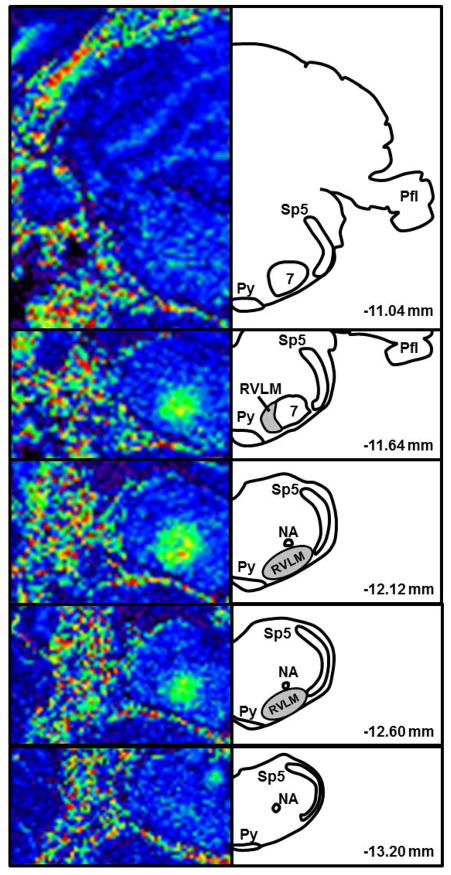
Figure 1. T1-weighted images following proof-of-concept study utilizing microinjection of MnCl2 into the pressor region of the RVLM.
MnCl2 (400 mM, 15 nl) was microinjected at the same coordinates used to functionally identify the RVLM by microinjection of glutamate (10 mM, 30 nl). MRI images (left) are matched rostrocaudally to diagrams drawn using a rat atlas for reference (right, Paxinos and Watson, 2007). In pseudocolored MR images, darker colors (blue) represent less Mn2+ enhancement and brighter colors (green, yellow, orange) represent greater Mn2+ enhancement. Shaded areas in diagrams represent the location of bulbospinal RVLM neurons (Schreihofer and Sved, 2011; Mueller and Llewellyn-Smith, 2013). Abbreviations: Sp5 = spinal trigeminal tract; 7 = facial nucleus; Py = pyramidal tract; NA = nucleus ambiguus; Pfl = paraflocculus; RVLM = rostral ventrolateral medulla.

