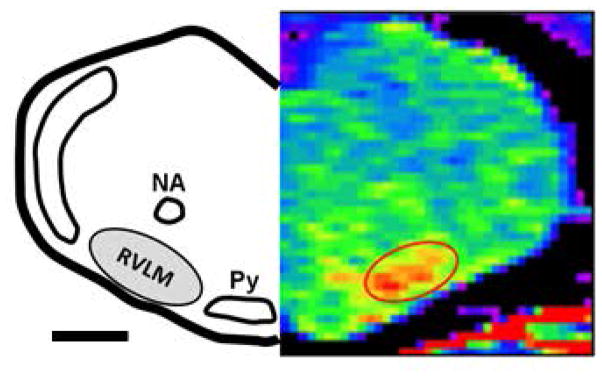
Figure 2. T1-Map MEMRI image following proof-of-principle study utilizing microinjection of MnCl2 (800 mM, 60nl) into the spinal cord at T9/T10.
Animals were imaged 48 hours after spinal cord injection to allow for retrograde transport by bulbospinal RVLM neurons. MR image (right) is matched to a diagram drawn using a standard rat atlas for reference (left, Paxinos and Watson, 2007). Scale bar represents ≈ 1000 μm. Abbreviations and color scheme as described in Figure 1.

