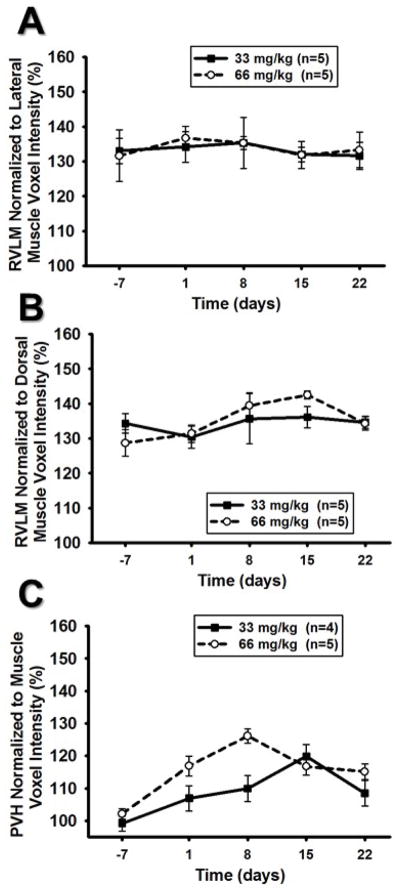
Figure 7. RVLM and PVH normalized to respective, adjacent muscle regions.
A) RVLM ROI mean voxel intensity normalized to the lateral muscle tissue did not result in a significant dose or time effect (p>0.05 for both main effects). B) RVLM ROI mean voxel intensity normalized to the dorsal muscle tissue resulted in a small but significant time effect (*, p<0.05 main effect of time) but the patterns indicate an increase rather than a decrease in voxel intensity over time. RVLM ROI mean voxel intensity normalized to the dorsal muscle tissue did not result in an effect of dose (p>0.05 for main effect). C.) PVH ROI mean voxel intensity normalized to surrounding muscle tissue showed significant effect of dose (#, p<0.05) and time (*, p<0.05) however, the graph indicates an increase rather than decrease in voxel intensities over time.

