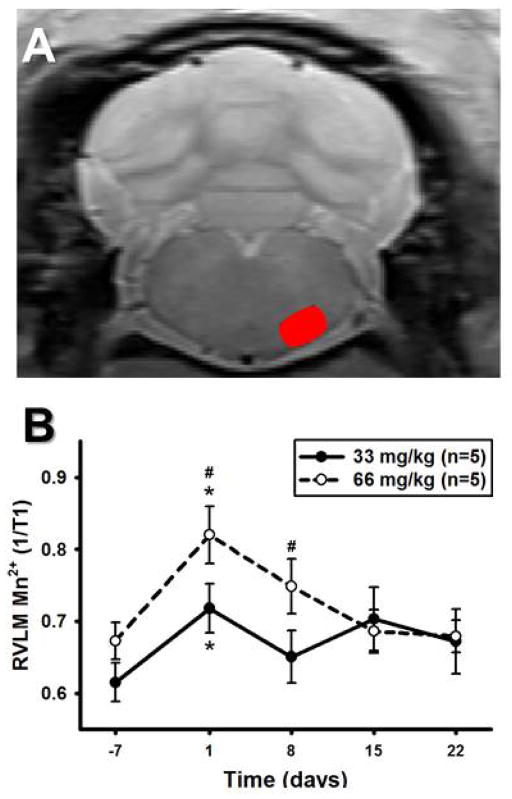
Figure 8. Mn2+ enhancement in the RVLM over time using T1-mapping.
A) Unprocessed, non-colorized T1-mapping MR image from one animal demonstrating detailed anatomy. Red oval denotes outline of RVLM used for regions of interest (ROIs) calculations. B) RVLM 1/T1 values over time using T1-mapping. After i.p. injections of 33 mg/kg or 66 mg/kg MnCl2 (n=5 for both), there were significant main effects of time and dose for the RVLM 1/T1 ratio. A significant interaction between dose and time allowed post hoc testing to reveal significant increases in Mn2+ enhancement one day after MnCl2 injection compared to the non-MnCl2 injected baseline scan for both doses (*, p<0.05). Injections of 66 mg/kg resulted in greater Mn2+ enhancement compared to injections of 33 mg/kg MnCl2 one and eight days after MnCl2 injection (#, p<0.05).

