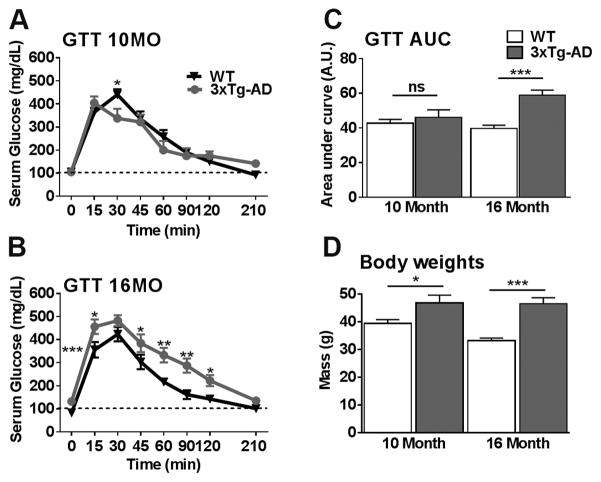
Figure 1. 3xTg-AD mice show an age-dependent onset of peripheral insulin resistance.
3xTg-AD and WT mice were given a glucose tolerance test. (A) At 10 months of age, a repeated measures ANOVA revealed no significant effect of Genotype (F (1, 28) = 0.026, p > 0.05), however there was a significant Genotype x Time interaction (F (1, 28) = 0.0032, p < 0.05). Interestingly the interaction was the result of the WT mice showing a significantly elevated serum glucose mg/DL level compared to 3xTg-AD mice 30 mins after sucrose injection (p < 0.05). No other time points were significant. (B) At 16 months of age, the repeated measures ANOVA revealed a significant main effect of Genotype (F (1, 28) = 17.183, p < 0.001) and a significant Genotype x Time interaction (F (1, 28) = 54.699, p < 0.0001). 3xTg-AD mice showed a significantly elevated serum glucose mg/DL level at fasting (0 mins; p < 0.0001) and 15 (p < 0.05), 45 (p < 0.05), 60 (p < 0.01), 90 (p < 0.01) and 120 mins (p < 0.05) after sucrose injection compared to WT mice. (C) Area under the curve (AUC) analysis for glucose revealed no differences at 10 months of age (t (28) = 0.470, p > 0.05). At 16 months of age, a highly significant student’s t-test revealed that 3xTg-AD have a higher glucose AUC compared to WT mice (t (28) = 27.322, p < 0.0001). (D) 3xTg-AD mice weight is significantly higher at 10 (t (28) = 4.883, p < 0.05) and 16 months of age (t (28) = 27.634, p < 0.0001) relative to their age-matched WT counterparts. Error bars represent mean ± SEM. *p < 0.05, **p < 0.01, ***p < 0.001. (n = 15/genotype/age).

