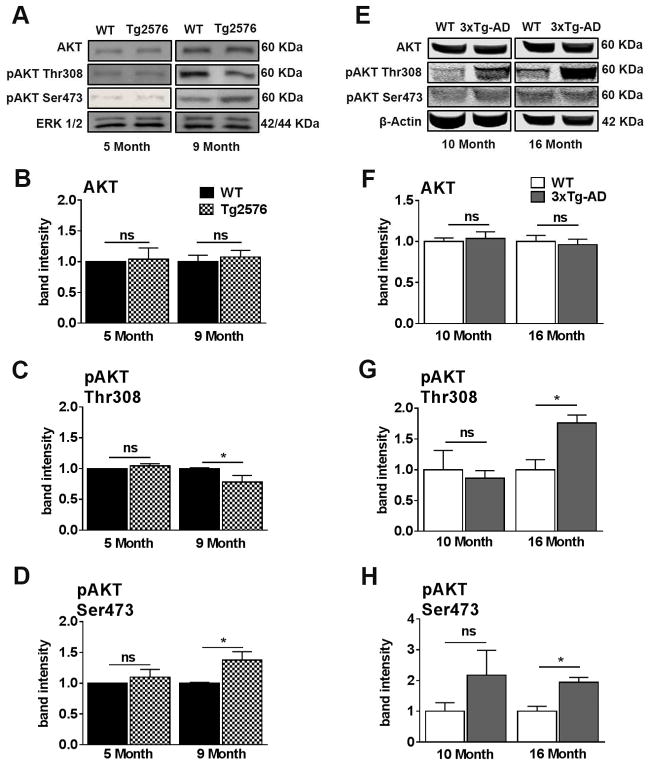
Figure 5. AKT activity is dysregulated concomitantly with peripheral insulin resistance in Tg2576 and 3xTg-AD mice.
(A) Representative western blots of protein extracted from both 5- and 9-month-old Tg2576 and WT mice. Blots were probed with the indicated antibodies. (B) AKT levels were not significant difference between 5- and 9-month-old WT and Tg2576 mice. (C) Phosphorylation of AKT at Thr308 was significantly downregulated in 9-month-old Tg2576 compared to WT mice (t (10) = 2.661, p < 0.05). (D) AKT was hyper-phosphorylated at Ser473 in 9-month-old Tg2576 compared to WT mice (t (10) = 2.710, p < 0.05). (E) Representative western blots of protein extracted from both 10- and 16-month-old 3xTg-AD and WT mice. (F) No significant differences were found between 10-month-old WT and 3xTg-AD mice and between 16-month-old WT and 3xTg-AD mice for AKT. (G) No significant differences were found between 10-month-old WT and 3xTg-AD mice for pAKT at Thr308. At 16 months of age, 3xTg-AD mice show a significant elevation in pAKT at Thr308 compared to WT mice (t (10) = 8.441, p < 0.05). (H) No significant differences for pAKT at Ser473 between 10-month-old WT and 3xTg-AD mice. At 16 months of age, 3xTg-AD mice show a significantly elevated level of pAKT at Ser473 compared to WT mice (t (10) = 7.989, p < 0.05). Quantitative analyses of the blots obtained by normalizing the quantity of a specific protein with its loading control. Error bars represent mean ± SEM. *p < 0.05, **p < 0.01, ***p < 0.001. n = 6/genotype/age.

