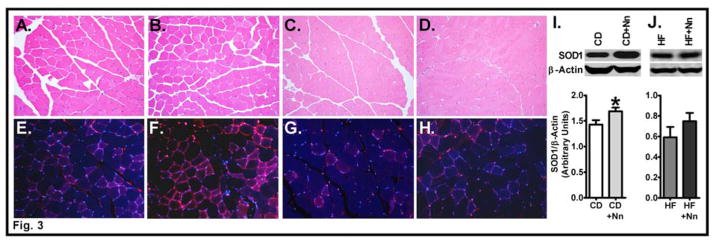
Fig. 3. Effect of Nano on markers of muscle histology and SOD1 content.
Muscle sections were stained with hematoxylin and eosin for histological analysis. Photomicrographs (20X) from CD (A), CD+Nano (B), HF (C), and HF+Nano (D) are shown. Muscle sections were stained for SOD1 protein content and fluorescent images obtained at 20X magnification from CD (E), CD+Nano (F), HF (G), and HF+Nano (H) groups. Representative picture from 3 samples per group is shown. Western blot analysis of SOD1 protein in muscle from CD (I) and HF diet-fed mice (J) are shown. Bands were quantified and values normalized to β-actin. Values are expressed as mean ± SEM of 6–8 samples per group.*P<0.05 vs CD. CD, Chow diet. HF, High fat, Nn, nanoSOD.

