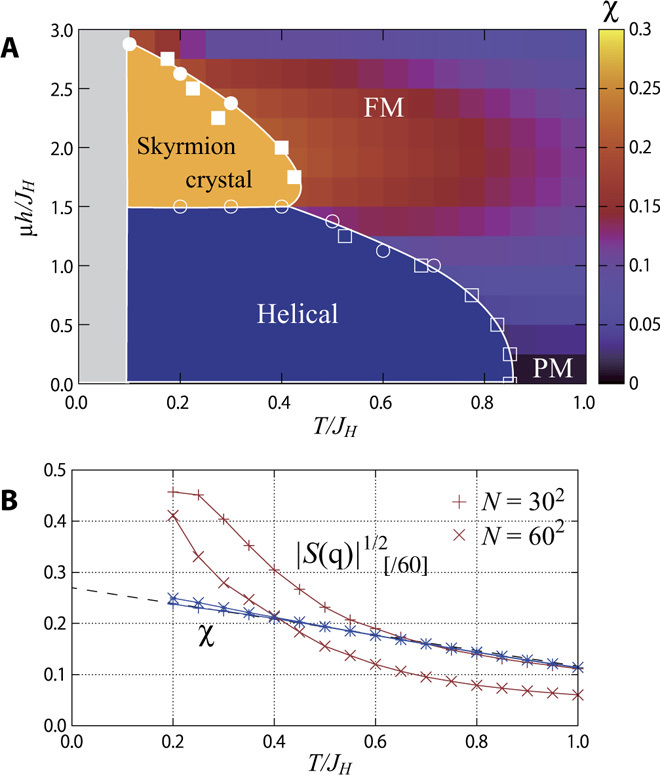
Fig. 2. Classical Monte Carlo simulation of two-dimensional chiral magnet.

(A) The phase diagram of the 2D chiral magnet in Eq. 18; the transverse axis is the temperature T and the longitudinal axis is the magnetic field h perpendicular to the plane. The squares (circles) are the phase boundary estimated from spin structure factor S(q) using the gradient of S(q) along the T/JH (μh/JH) axis. Open (solid) symbols indicate the phase boundary for the helical (skyrmion crystal) order. The lines are merely a guide for the eyes. The contour plot in the paramagnetic (PM)/ferromagnetic (FM) phase shows the thermal average of the scalar spin chirality χ. The low-temperature region shaded in gray is the region where the MC simulation freezes because of low temperature. See the text for details. (B) Temperature dependence of spin structure factor S(q) and chirality χ for h/JH = 2.0; the two curves are for N = 302 and 602.
