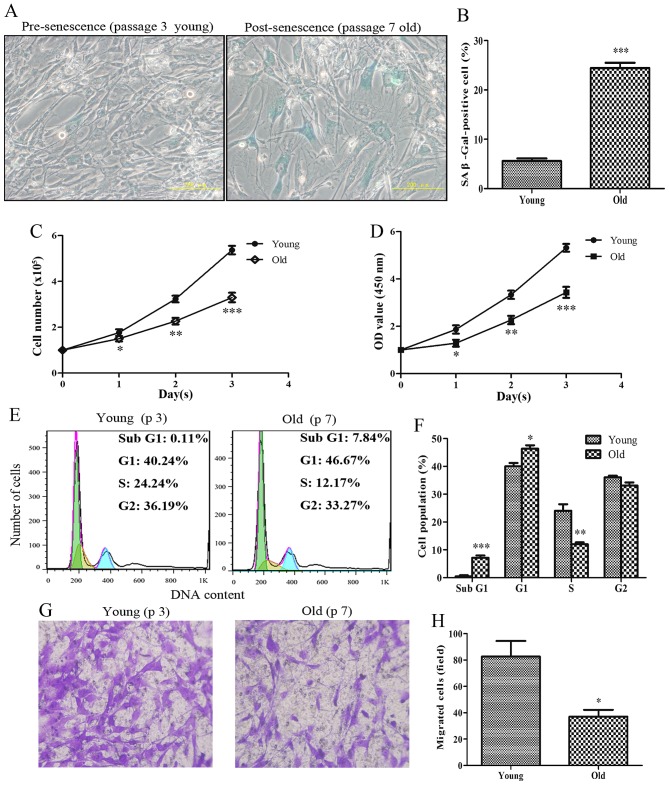
Figure 1.
Senescent primary HASMCs exhibit a decrease in proliferation and migration. Young (passage number 3) and old (passage number 7) cells were seeded at a density of 1×10⁵ cells/well in 6-well culture plates (SA-β-gal staining assay, cell counting assay, CCK-8 assay and cell cycle assay). (A) SA-β-gal activity was detected using a SA-β-gal staining assay following culturing for 3 days. Blue cells were considered SA-β-gal-positive cells. (B) Histogram represents the percentage of SA-β-gal-positive cells. (C) Number of cells was counted per well after 0, 1, 2 and 3 days. (D) Cell viability was detected using the Cell Counting kit-8 assay after 0, 1, 2 and 3 days. (E) Cell cycle progression was detected using a cell cycle assay following culturing for 3 days. (F) Histogram represents the percentage of cells in each cell cycle phase. (G) After culturing for 3 days, equal numbers of young and old cells (0.5×10⁵) were seeded into the upper Transwell chambers and were cultured for 24 h. Representative images of stained and migrated cells are presented; magnification, ×200. (H) Number of migrated cells was quantified by counting the cells from six random fields. All data are presented as the means ± standard deviation from three independent experiments. *P<0.05, **P<0.01 and ***P<0.001 vs. the young group. HASMCs, human aortic smooth muscle cells; OD, optical density; SA-β-gal, senescence-associated β-galactosidase.

