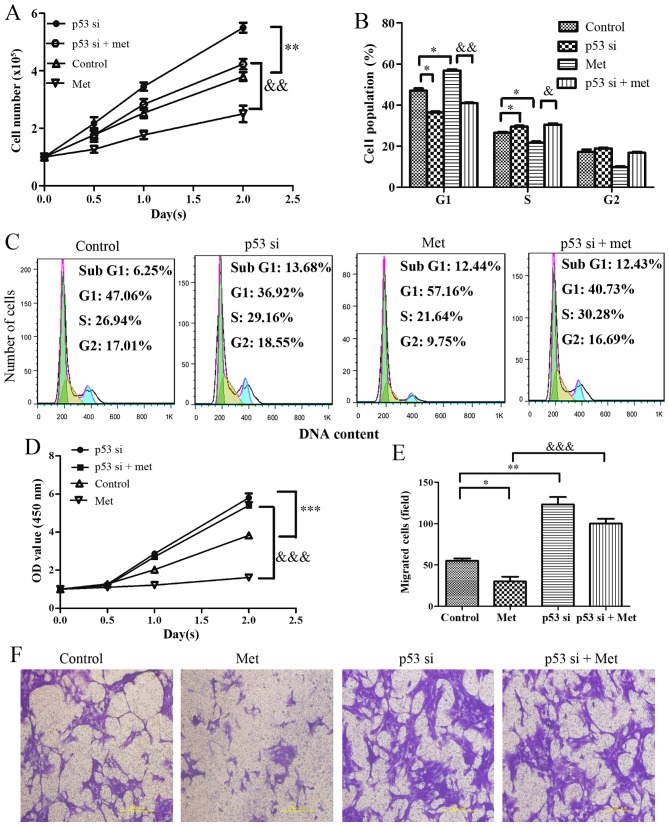
Figure 6.
Effects of p53-knockdown on Met-mediated growth arrest and migratory inhibition in HASMCs (passage 3). Control HASMCs and p53-silenced HASMCs (48 h post-transfection) were treated with or without 10 mM metformin for 24 h. (A) Control HASMCs (Control), p53-silenced HASMCs (p53 si), control HASMCs treated with Met (Met) and p53-silenced HASMCs treated with Met (p53 si + Met) were seeded at a density of 1×10⁵ cells/well in 6-well culture plates (cell counting assay, CCK-8 assay and cell cycle assay). Number of cells per well was counted at 0, 0.5, 1.0 and 2.0 days. (B and C) Cell cycle analysis was performed to evaluate the number of cells in each phase of the cell cycle in each group. Histogram represents the percentage of cells in each cell cycle phase. (D) Cell viability was detected using the Cell Counting kit-8 assay at 0, 0.5, 1.0 and 2.0 days. (E and F) Cell migration was detected by Transwell assay in each group. Representative images of stained and migrated cells are shown; magnification, ×200. Histogram represents the number of migratory cells per field from six random fields. All data are presented as the means ± standard deviation from three independent experiments. *P<0.05, **P<0.01 and ***P<0.001 vs. the control group; &P<0.05, &&P<0.01 and &P<0.001 vs. the Met group. HASMCs, human aortic smooth muscle cells; Met, metformin; OD, optical density; si, small interfering RNA.

