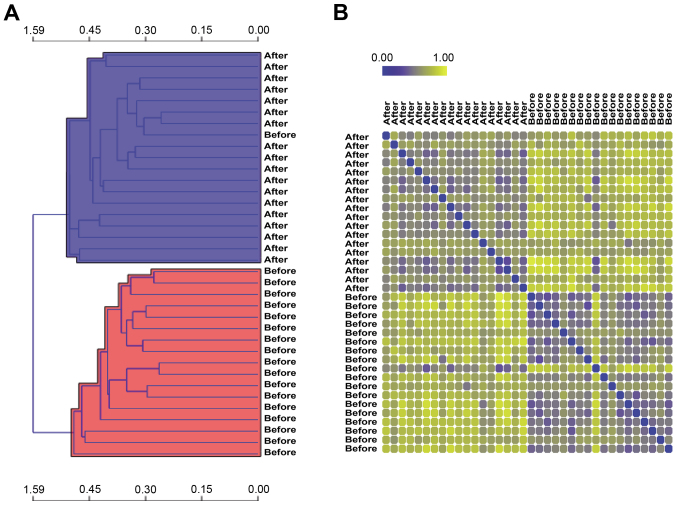
Figure 1.
(A) Heat map of hierarchical clustering analysis (horizontal and vertical axes represent similarity distance and OS biopsy specimens before/after metastasis, respectively). (B) Distance map demonstrating the distances between the remaining 36 samples (blue and yellow separately represent close and far distances, respectively). OS, osteosarcoma.

