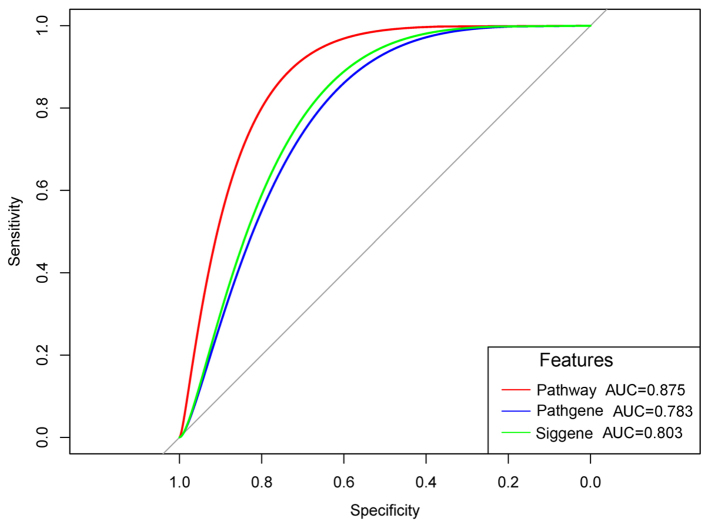
Figure 5.
Receiver operating characteristic curves. Red curve indicates the prediction accuracies of the recurrent risk-associated terms (pathway); blue curve indicates the prediction accuracies of the genes enriched in the recurrent risk-associated terms (Pathgene); green curve indicates the prediction accuracies of the differentially expressed genes (Siggene). AUC, area under the curve.

