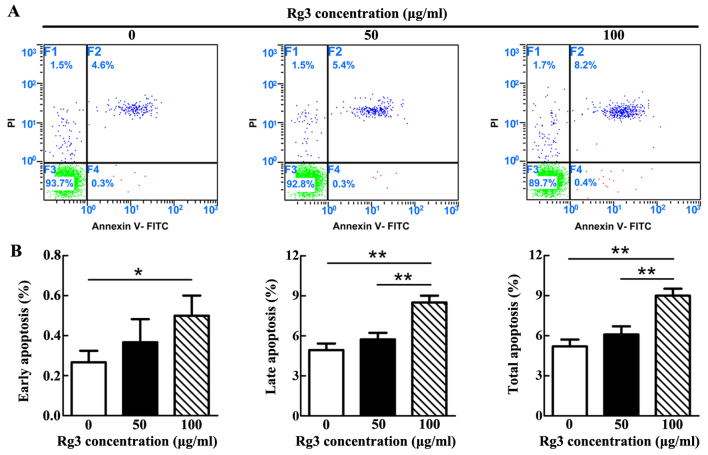
Figure 2.
Percentage of apoptotic cells, as measured by FCM after Annexin V/PI staining. (A) Apoptotic rate gradually increased as the concentration of Rg3 increased. (B) Statistical analysis of FCM. Marked differences existed between the control and 100 μg/ml-Rg3-treated groups, with regards to early apoptosis, but no distinct differences were detected between the control and 50 μg/ml-Rg3-treated groups in each phase of apoptosis. *P<0.05. FCM, flow cytometry; FITC, fluorescein isothiocyanate; PI, propidium iodide; Rg3, ginsenoside Rg3. **P<0.01.

