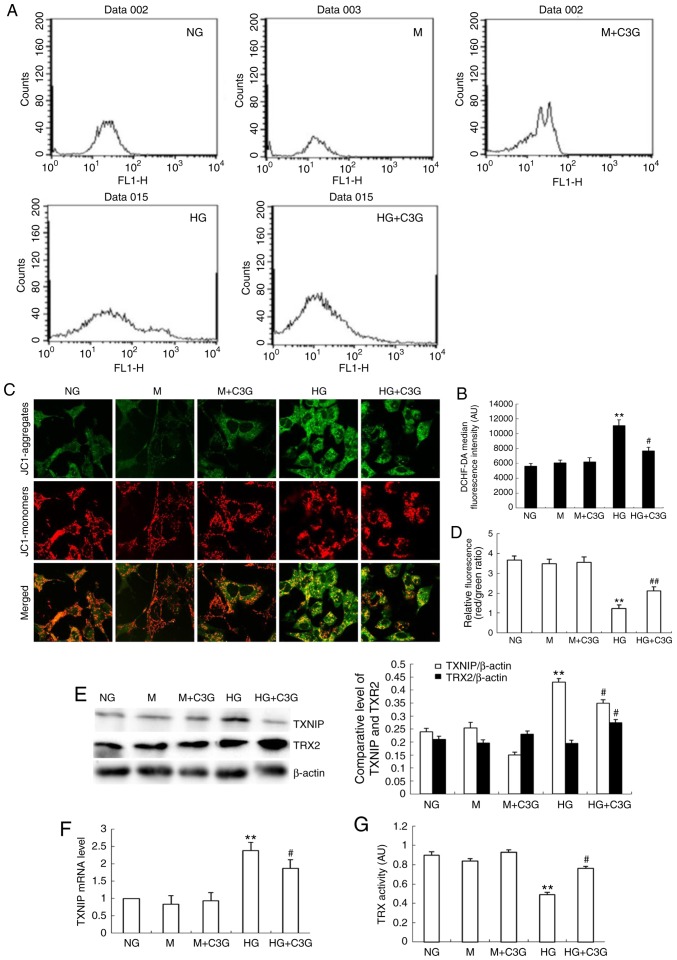
Figure 6.
Effects of treatment with C3G on HG-induced MMP and ROS production, expression of TXNIP and TRX2 expression and TRX activity in HK-2 cells. HK-2 cells were incubated with NG (5.6 mM), NG + 30 mM M, M + C3G (50 μM, M + C3G), HG (30 mM) and HG + C3G (50 μM, HG + C3G) for 48 h. (A) Intracellular ROS was determined via flow cytometry and (B) quantified. (C) MMP was determined using a fluorescent probe, JC1, and (D) quantified. The MMP loss was quantified from the shift of JC-1 emission from red (~590 nm) to green (~525 nm). The ratio of red/green fluorescence represented MMP in HK-2 cells. Treatment with C3G significantly suppressed intracellular ROS production in HK-2 cells exposed to HG conditions. (E) The expression levels of TXNIP and TRX2 were determined using western blotting, and the relative intensities of the TXNIP and TRX2 bands were normalized to the β-actin band. (F) The mRNA expression of TXNIP was determined via reverse transcription-quantitative polymerase chain reaction. (G) TRX activity was determined using an insulin disulfide reduction assay. Values are expressed as mean ± standard deviation (n=6). **P<0.01 vs. NG; #P<0.05 vs. HG. HG, high glucose; NG, no glucose; M, mannitol; C3G, cyanidin-3-O-β-glucoside chloride; TXNIP, thioredoxin interacting protein; TRX, thioredoxin; TRX2, thioredoxin 2; MMP, mitochondrial membrane potential; DCHF-DA, dichlorodihydro-fluorescein diacetate.

