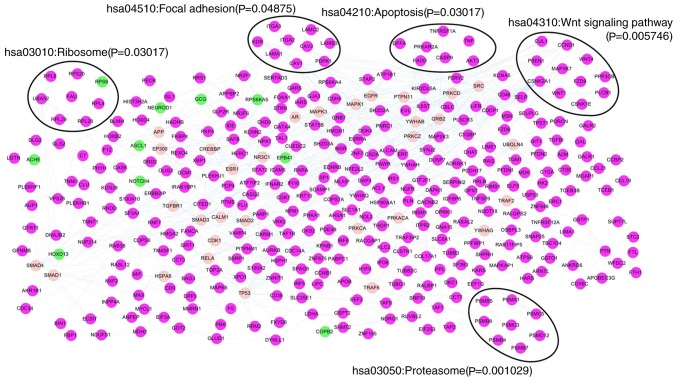
Figure. 2.
Protein-protein interaction network of critical genes. A total of 392 nodes and 686 edges were included. The nodes represented the differentially expressed genes. Purple represents upregulated genes in stage II; green represents downregulated genes in stage II; light pink represents non-differentially expressed genes.

