. 2018 Feb 7;7:e35034. doi: 10.7554/eLife.35034

Figure 2. Depletion of 4EHP expression affects cell proliferation, survival, and ERK1/2 phosphorylation.

(A) Cell proliferation assay. WT and 4EHP-KO MEFs were seeded in 6-well plates and trypsinized after the indicated time points and cell numbers determined using a hematocytometer. Data are mean ± SD (n = 3). (B) Cell proliferation assay. U251 cells with stable expression of shCTR (control), sh4EHP#1, and sh4EHP#2 were seeded in 6-well plates. Cells were trypsinized after the indicated time points and cell numbers determined using a hematocytometer. Data are mean ± SD (n = 3). (C) Quantitation of cell death by FACS assay; Sub-G population was considered as ‘Dead’ and G0/1, S and G2/M population was combined as ‘Live’. Data are mean ± SD (n = 3). (D) WB for the indicated proteins in the WT and 4EHP-KO MEFs. (E) Polysome profiling/RT-PCR; RNA was extracted from each fraction (collected as described in Figure 2—figure supplement 1J), subjected to electrophoresis on agarose gel and visualized, using Ethidium Bromide (EtBr) staining. RT-PCR analyses of total RNA in each fraction was carried out with primers specific for Dusp6 and Gapdh mRNAs. (F) WB on the indicated proteins in WT and 4EHP-KO MEFs. (G) WB for the indicated proteins in the WT and 4EHP-KO MEFs, expressing a v5-tagged GFP (GFP-v5) or v5-tagged 4EHP (4EHP-v5).

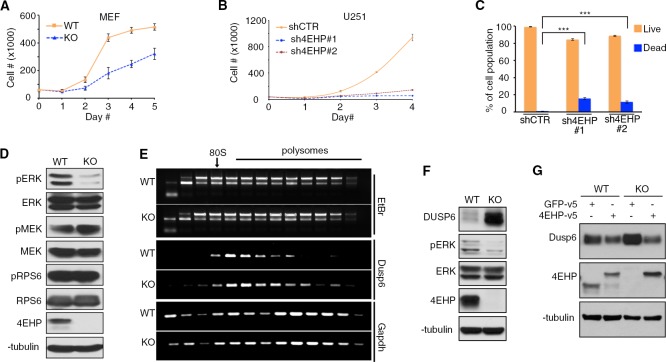
Figure 2.

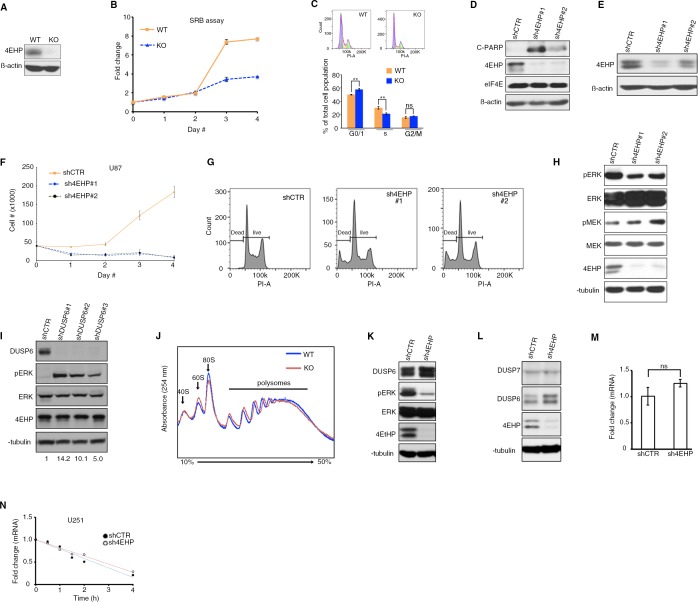
Figure 2—figure supplement 1. Cell proliferation and translational regulation of DUSP6 expression is affected by 4EHP depletion.

Figure 2—figure supplement 1.

(A) WB for the indicated proteins in the WT and 4EHP-KO MEFs. (B) Cell proliferation was assessed using Sulforhodamine B (SRB ) assay . Data are mean ± SD (n = 3). (C) Top; Representative cell cycle profiles of the WT and 4EHP-KO MEFs stained with Propidium Iodide and analyzed by FACS. Bottom; quantitation of cell cycle profiles. Data are mean ± SD (n = 3). (D) WB for the indicated proteins in control and stable 4EHP-knockdown U251 cells. (E) WB for the indicated proteins in the control and stable 4EHP-knockdown U87 cells. (F) Cell proliferation assay; U87 cells with stable expression of shCTR, sh4EHP#1, and sh4EHP#2 were seeded in 6-well plates. Cells were trypsinized after the indicated time points and cell numbers determined using a hematocytometer. Data are mean ± SD (n = 3). (G) FACS assay. Representative cell cycle profiles of shCTR, sh4EHP#1, and sh4EHP#2 U251 cells stained with Propidium Iodide and analyzed by FACS. (H) WB for the indicated proteins in the control and stable 4EHP-knockdown U251 cells. (I) WB for the indicated proteins in the control and stable Dusp6-knockdown U251 cells. (J) Polysome profiling; cytoplasmic extract from WT and 4EHP-KO MEFs was fractioned by centrifugation on a 10–50% sucrose gradient. Fourteen fractions were collected while 254 nm absorbance was recorded. (K) WB for the indicated proteins in control (shCTR) and 4EHP-knockdown (sh4EHP) U251 cells. (L) WB for the indicated proteins in the control and stable 4EHP-knockdown U251 cells. (M) RT-qPCR analysis of Dusp6 mRNA in shCTR and sh4EHP U251 cells. Values are normalized to β-actin. Data are mean ± SD (n = 3). (N) RNA stability assay of Dusp6 mRNA in shCTR and sh4EHP U251 cells. The amount of RNA at different time points was determined by RT-qPCR. Values are normalized to 28S rRNA. Data are mean ± SD (n = 3).