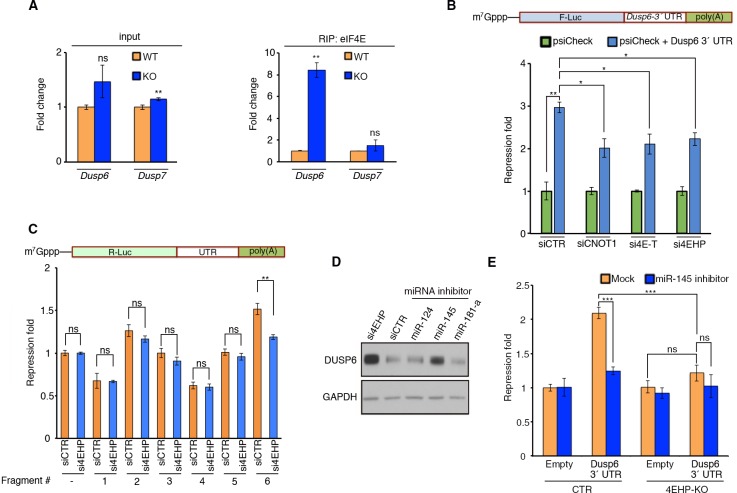
Figure 3. 4EHP enables miRNA-mediated silencing of Dusp6 mRNA.
(A) RIP analysis of the association of eIF4E with Dusp6 mRNA in WT and 4EHP-KO MEFs. eIF4E was immunoprecipitated using a monoclonal antibody. Levels of the indicated mRNAs (normalized to β-actin mRNA) in the inputs and eIF4E-bound mRNAs were analyzed by RT–qPCR. Data are mean ± SD (n = 3). (B) Top; Schematic representation of the psiCHECK-FL-Dusp6 3´ UTR reporter. Bottom; CTR, CNOT1, 4E-T, or 4EHP-knockdown cells were co-transfected with psiCHECK-FL-Dusp6 3´ UTR reporter or the psiCHECK reporter (as control) in HEK293T cells. Luciferase activity was measured 24 hr after transfection. Firefly (F-Luc) values were normalized against Renilla (R-Luc) levels, and repression fold was calculated for the psiCHECK-FL-Dusp6 3´ UTR reporter relative to psiCHECK reporter level for each condition. Data are mean ± SD (n = 3). (C) The psiCHECK reporter (control) or psiCHECK-RL with truncated fragments of the Dusp6 3´ UTR were transfected into the HEK293T cells. Luciferase activity was measured 24 hr after transfection. R-Luc values were normalized against F-Luc levels, and repression fold was calculated for the psiCHECK-RL-Dusp6 3´ UTR reporter relative to psiCHECK reporter level for each condition. Data are mean ± SD (n = 3). (D) WB for the indicated proteins in U251 cells transfected with si4EHP or the indicated miRNA inhibitors. (E) The psiCHECK reporter (control) or psiCHECK-FL-Dusp6 3´ UTR were co-transfected along with the mock or miR-145 inhibitor in the control (CTR) or 4EHP-KO HEK293 cells. Luciferase activity was measured 24 hr after transfection. F-Luc values were normalized against R-Luc levels, and repression fold was calculated relative to the psiCHECK reporter/control inhibitor for each condition. Data are mean ± SD (n = 3). The p-values was determined by two-tailed Student's t‐test: (ns) non-significant, (*) p<0.05; (**) p<0.01; (***) p<0.001.


