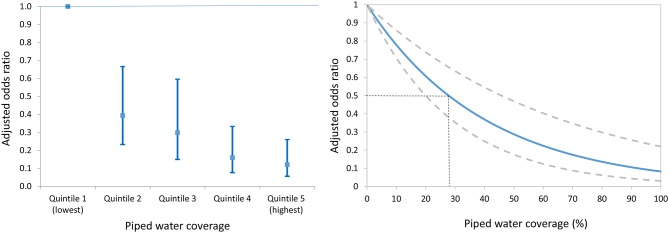
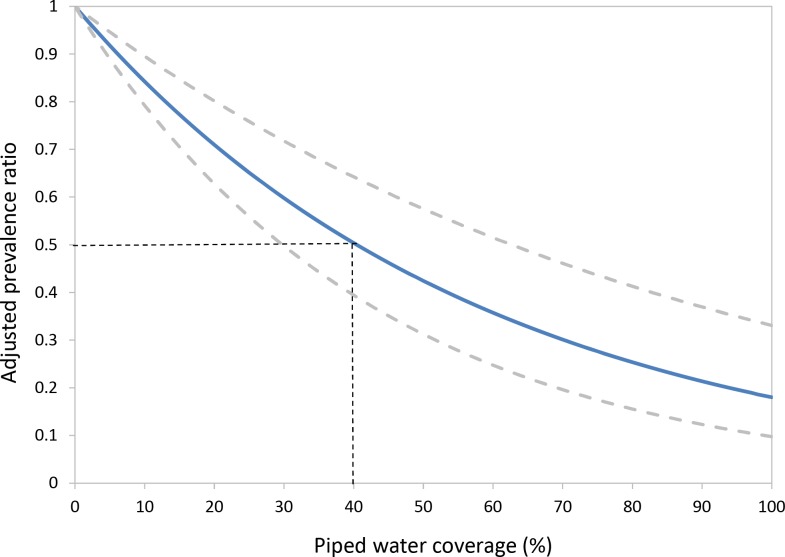
Figure 4. Adjusted odds ratio of Schistosoma haematobium infection (95% CI) by piped water coverage in the surrounding local community - coverage quintile (Left) and continuous piped water coverage (Right).
The piped water coverage measure (2001–2007) is derived using a Gaussian kernel to calculate the proportion of all households in the unique local community surrounding each participant having access to piped water (Figure 3). Odds ratios are adjusted for age, sex, household assets, toilet in household, landcover class, distance to water body, altitude, slope, treatment in the last 12 months and school grade. Standard errors are adjusted for clustering by school and grade.


