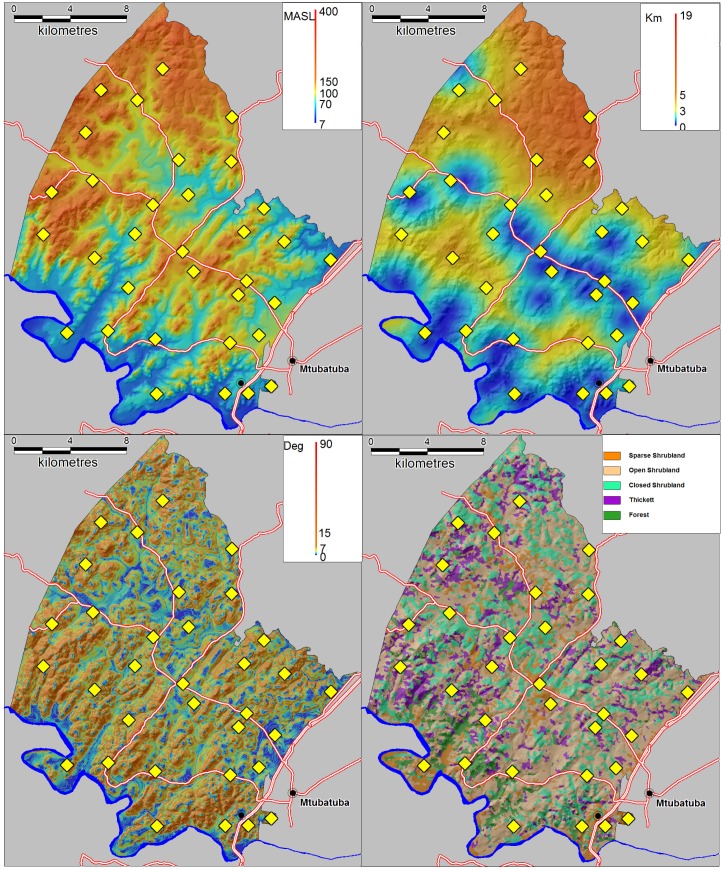
Figure 8. Environmental control variables used in the statistical analysis with locations of 33 schools superimposed (yellow diamonds).
(Top left) Altitude in metres above sea level (MASL) (Top right) Distance to nearest water body (km) (Bottom left) Slope (degrees) (Bottom right) Satellite-derived landcover classification.

