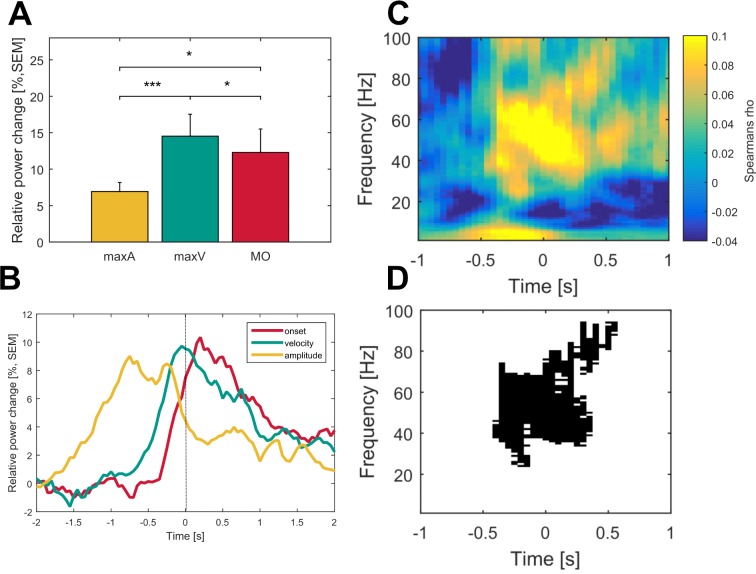
Figure 3. Gamma activity is strongest during maximum movement velocity and directly correlates with movement velocity on a single-trial level across patients.
Averaged gamma band activity was aligned to different time points of the movement execution (A; onset – red, velocity – green, amplitude – yellow) to allow comparison of a temporal focus in gamma synchronization. (B) Gamma activity was significantly higher aligned to the time point of maximum velocity (green) when compared to an alignment on maximum amplitude (yellow, p<0.001) and movement onset (red, p=0.02). (C) Single-trial Spearman’s correlations with movement velocity across all time frequency bins aligned to maximum movement velocity (time 0 s) were conducted in all patients. (D) Robust positive correlations were spectrally and spatially distinct to the gamma band (p<0.05, FDR corrected) of the contralateral hemisphere. No significant time frequency bins were revealed for the ipsilateral hemisphere (data not shown).

