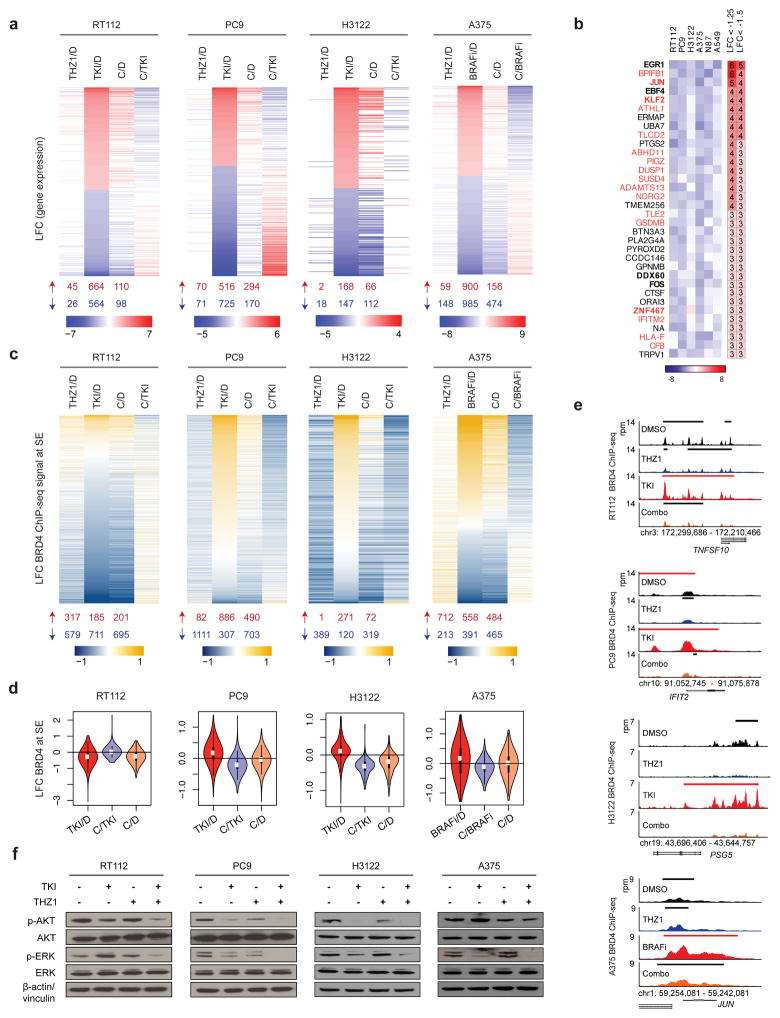
Figure 3. THZ1 attenuates targeted therapy-induced transcriptional and enhancer remodeling.
a, Differentially expressed genes at 48 hours following treatment with THZ1, TKI or BRAFi, or THZ1 in combination with TKI or BRAFi (Combination, C) compared to DMSO control (D), filtered by genes that were up- or downregulated greater than or equal to 1.5 log2-fold change (LFC) of read counts per million with targeted kinase inhibition, or less than or equal to −1.5 LFC, respectively. Column four shows LFC of combination-treated versus targeted therapy-treated cells (C/TKI, C/BRAFi). Heat maps show averaged values for 3 biological replicates per condition. The number of upregulated and downregulated genes (LFC ≥1.5, and ≤ −1.5, respectively) for each condition is summarized below each column, in red and blue respectively. LFC values between −1.5 and 1.5 are shown in white.
b, Heat map showing most downregulated genes in combination-treated cells versus targeted therapy-treated cells across all six cell lines. Only genes whose expression was downregulated less than −1.5 LFC were considered, and only genes affected in a minimum of three cell lines were included. Genes in bold are transcription factors. Genes in orange are EGR1 targets. Columns on the right indicate the number of cell lines with LFC<−1.25, and LFC<−1.5 for each respective gene.
c, LFC of BRD4 ChIP-seq signal at super-enhancer regions (SE) following 48-hour treatment with THZ1, targeted-therapy (TKI, BRAFi) or THZ1 in combination with targeted therapy (C) compared to DMSO control (D). The fourth column shows combination treatment compared to targeted therapy treatment (C/TKI). The heat map plots the union of SE regions identified in DMSO-treated cells and targeted therapy-treated cells. The number of upregulated and downregulated regions is summarized below each column, in red and blue respectively.
d, Violin plots showing the distribution of LFC of BRD4 ChIP-seq density at super-enhancer regions plotted in (c), for TKI compared to DMSO control (D), combination treatment compared to targeted therapy treatment (C/TKI), and combination compared to DMSO control (C/D).
e, BRD4 gene tracks for control-, THZ1-, targeted therapy (TKI)-, and combination (Combo)-treated cells for TNFSF10 (RT112), IFIT2 (PC9), PSG5 (H3122), and JUN (A375). Signal of ChIP-seq occupancy is in reads per million (rpm). Black bars indicate typical enhancers and red bars super-enhancers.
f, Immunoblot analysis for AKT and ERK activity for cells treated for 24 hours with control, the corresponding kinase inhibitor (BRAFi for A375), THZ1, or THZ1 in combination with the kinase inhibitor, at the doses used in colony formation assays.

