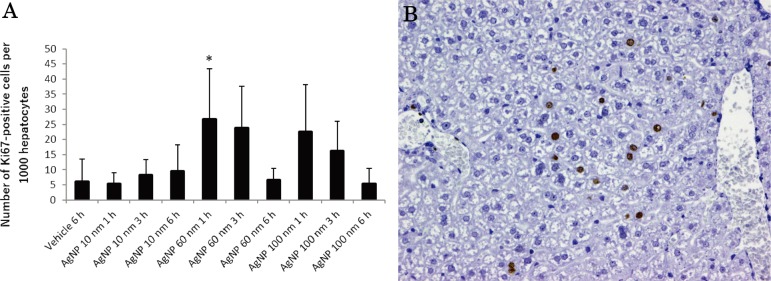
Fig. 4.
Evaluation of Ki-67-positive cells in the liver. (A) The graphs show positive cells per 1,000 hepatocytes in the vehicle control at 6 h; 10 nm AgNP group at 1 h, 3 h, and 6 h; 60 nm AgNP group at 1 h, 3 h, and 6 h; and 100 nm AgNP group at 1 h, 3 h, and 6 h. Ki-67-positive cells in the 60 nm AgNP group at 1 h were significantly increased as compared with those of the vehicle control. Data are the means ± standard deviations (SDs) of each group (n=5 except n=4 for 100 nm AgNPs at 3 h). *P<0.05 versus the vehicle control group. (B) Photomicrographs show the distribution of Ki-67-positive cells in the liver of the 60 nm AgNP group at 1 h. Ki-67-positive cells were observed mainly in the midlobular zone of the liver lobule (×200).

