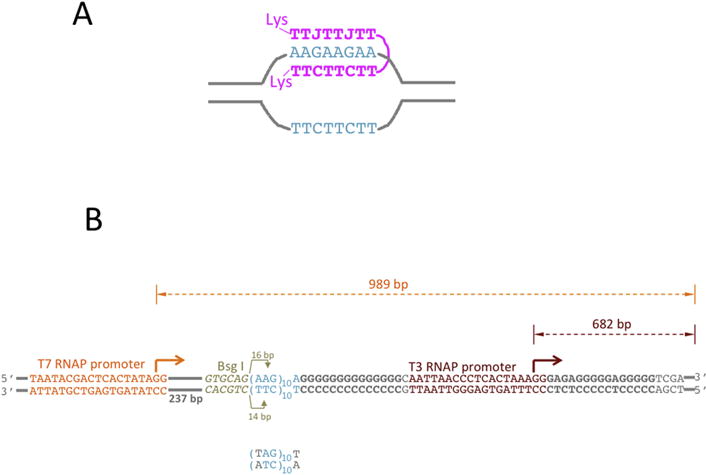
Fig. 2. PNA-DNA hybrids and DNA substrates.

A: PNA-DNA hybrid. PNA is shown in magenta; The DNA sequence that binds PNA is shown in turquoise, the rest of DNA is shown in gray lines. The TTC-moiety of PNA forms Watson-Crick base pairing with the complementary DNA strand, while the TTJ-moiety forms Hoogsteen base pairing with that same DNA strand. J is pseudoisocytosine, which is a cytosine analog that forms non-protonated Hoogsteen base pairing with G, thus relaxing the pH-dependence for triplex formation. CTT and JTT PNA moieties are connected by a flexible linker, which is comprised of three 8-amino-3,6-dioxaoctonic acid residues. Each PNA end contains positively charged lysine (Lys) residue that increases PNA solubility and additionally strengthens PNA-DNA interaction. B: DNA substrates for transcription. PNA binding sequence is shown in turquoise. It contains ten AAG repeats, which provide binding sites for about three PNA molecules. The mutated PNA binding sequence is shown below. It contains A-T inversion in each repeat (shown in gray), which disrupts PNA-DNA binding. Immediately upstream from the PNA binding sequence, there is a Bsg I restrictase recognition sequence (shown in yellowish-gray italic). Bsg I cleaves an arbitrary sequence at exact distance (shown by yellowish-gray arrows) from its recognition site. The Bsg I cleavage site is localized roughly in the middle of PNA binding sequence; and, consequently, the cleavage is inhibited upon PNA binding. This cleavage inhibition could be used to monitor PNA binding. T3 (“primary”) and T7 (“secondary”) promoters are shown in brown-red and orange, respectively. Bent arrows show the start and the direction of transcription. The distance from the starts to the end of the template (shown by double-arrowed dashed lines) correspond to the size of respective full-size (run-off) transcripts. The rest of DNA is shown in gray. G-rich sequences downstream from the PNA binding site and from the T3 promoter are shown in bold gray.
