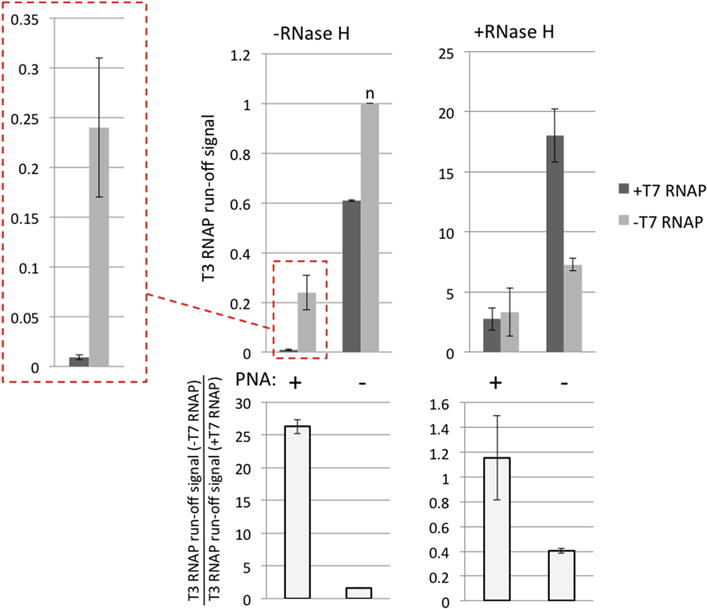
Fig. 6. Quantitation for the results from Fig. 5 and its repetition.

Quantitation was performed in the same way, as for Fig. 4. Note that the height of the column marked “n” (top-left panel) that corresponds to PNA(−), T7(−), RNaseH(−) conditions was used for normalization of both RNase H(−) and RNase H (+) data.
