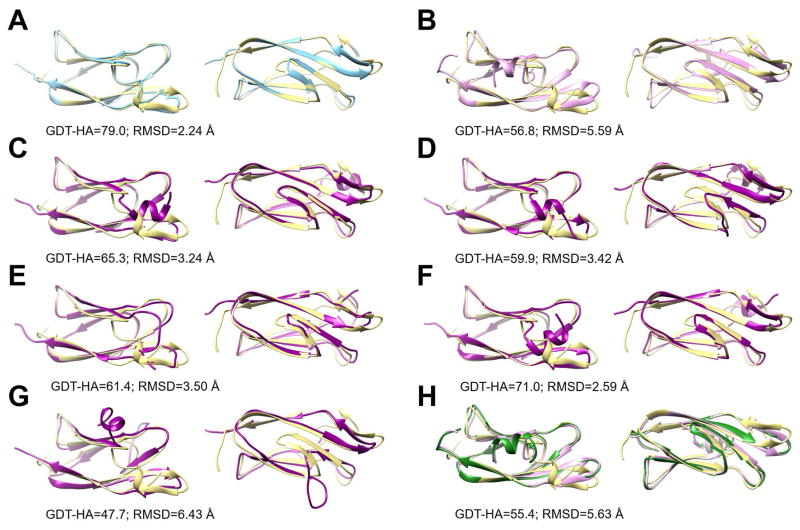
Figure 8.
Structures for target TR872 during refinement and with additional MD-based sampling. The native structure is shown in yellow in all panels and compared with the MD-simulated average structure of the native state (blue; A), the initial model given during CASP12 for refinement (pink; B), structures sampled via MD from the initial model and designated as states S0–S4 (cf. Figure 7, purple, C–G), and the model submitted during CASP12 (green, H). Structures are shown in two views and for each panel, GDT-HA and Cα RMSD measures relative to the native structure are given.

