
Figure 3.
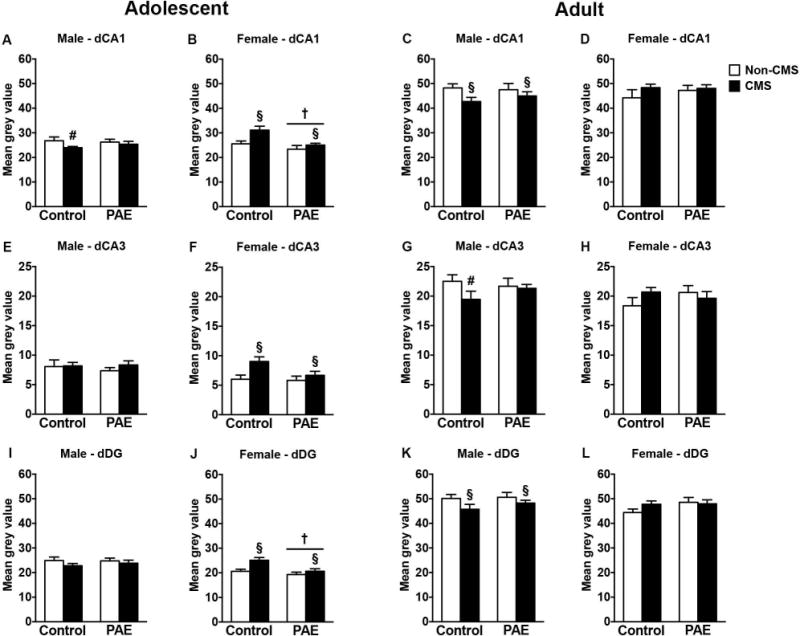
Short- and long-term effects of adolescent CMS on dorsal hippocampus GR mRNA expression in control and PAE rats. Bars represent the mean ± SEM (mean gray value) of GR mRNA expression in the CA1 (A-D), CA3 (E-H), and DG (I-L). † indicates a significant main effect of prenatal treatment, where all PAE animals are different from control animals; § indicates a significant main effect of CMS exposure, where all animals exposed to CMS are different from animals not exposed to CMS; for A and G, # indicates that control CMS is different from control non-CMS based on a priori comparisons (n = 6-10 for all groups).