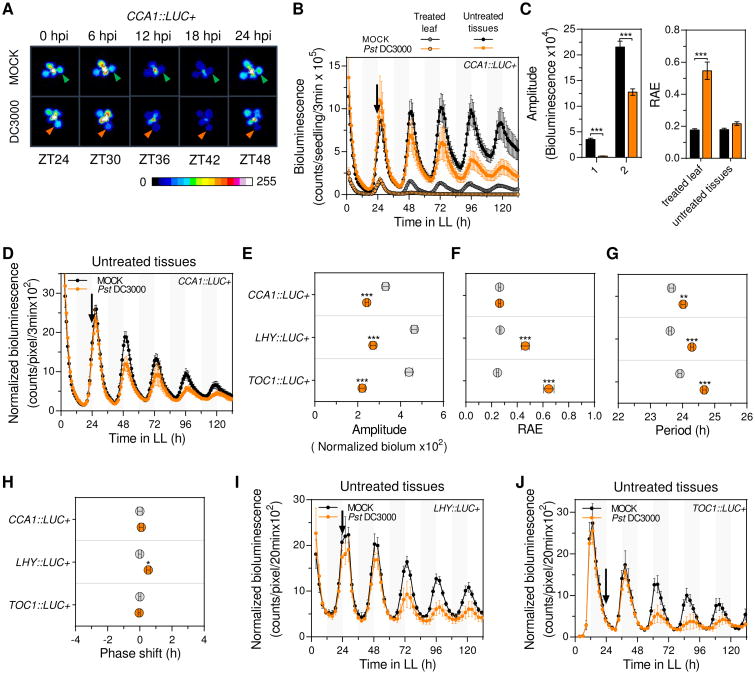
Figure 1. Localized P. syringae infection triggers systemic clock responses.
(A) Representative time course pseudocolored bioluminescence images of soil grown CCA1∷LUC+ plants upon single leaf Pst DC3000 infection or mock treatment (hpi: hours post infection). Triangles (Pst DC3000: orange, mock: green) point to the treated leaf.
(B) Luciferase activity from treated leaf or untreated tissues of soil grown Arabidopsis CCA1∷LUC+ plants upon single leaf Pst DC3000 infection (orange) or mock treatment (black). Treatments were performed at ZT24 (denoted by the black arrow) (see also Figure S1A). Results indicate mean values [± SD, n=6] and are representative of 5 independent experiments.
(C) Mean amplitude (left panel) and relative amplitude error (RAE) (right panel) values [± SEM]of CCA1∷LUC+ rhythms in treated leaf or untreated tissues upon single leaf Pst DC3000 infection (orange) or mock treatment (black) for experiments indicated in (B) (n=30).
(D) Luciferase activity (normalized by plant size) from untreated tissues of soil grown Arabidopsis CCA1∷LUC+ plants upon single leaf Pst DC3000 infection (orange) or mock treatment (black). Results indicate mean values [± SD, n=6] and are representative of 5 independent experiments.
(E-H) Mean amplitude (E), relative amplitude error (RAE) (F), period (G) and phase shift values (H) [± SEM] of CCA1∷LUC+ (n=30), LHY∷LUC+ (n=15) and TOC1∷LUC+ (n=15) normalized luciferase activity rhythms upon single leaf Pst DC3000 infection (orange) or mock treatment (gray) for experiments indicated in (D, I and J).
(I-J) Luciferase activity (normalized by plant size) from untreated tissues of soil grown Arabidopsis LHY∷LUC+ and TOC1∷LUC+ plants upon single leaf Pst DC3000 infection (orange) or mock treatment (black). Results indicate mean values [± SD, n=9] and are representative of 2 independent experiments.
Statistical analyses between mock and infected plants were performed using the t test (C, E, F, G and H). Stars indicate the level of significance (*p<0.01, **p<0.001, ***p<0.0001).

