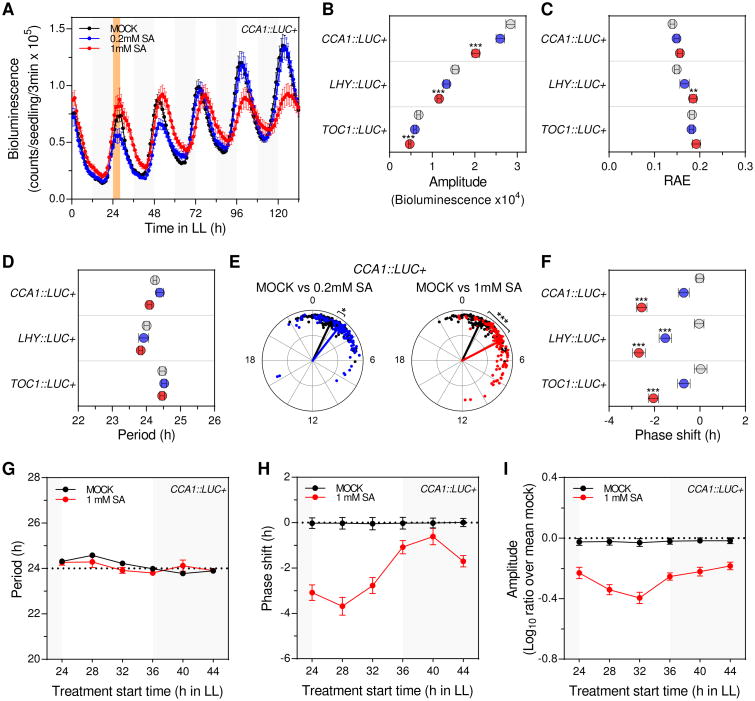
Figure 2. Transient SA treatment phenocopies P. syringae-triggered amplitude reduction and delays the phase of clock rhythms.
(A) Luciferase activity from CCA1∷LUC+ seedlings after transient SA treatment. Seedlings were treated with medium alone (mock) or supplemented with SA (0.2mM and 1 mM) at ZT24 for 4h (denoted by the orange shadowed area) (see also Figure S2A). Results indicate mean values [± SEM, n=12] and are representative of 7 independent experiments.
(B-D) Mean amplitude (B), relative amplitude error (RAE) (C) and period (D) values [± SEM] of CCA1∷LUC+ (n=110), LHY∷LUC+ (n=60) and TOC1∷LUC+ (n=60) rhythms after mock (grey), 0.2mM SA (blue) or 1mM SA (red) transient treatments for experiments indicated in (A) and Figure S2D.
(E) Normalized phase and RAE values of CCA1∷LUC+ rhythms after transient SA treatment for experiments indicated in (A) (mock: black, 0.2mM SA: blue and 1mM SA: red) (each dot represents one individual). The angular position of dots and arrows indicates the normalized phase value (0-24h) and the radial position indicates the RAE value (RAE=0 at the outmost radial position and RAE=1 at the center). The arrow points to the mean normalized phase and the arrow length indicates the mean RAE.
(F) Mean phase shift values [± SEM] of CCA1∷LUC+ (n=110), LHY∷LUC+ (n=60) andTOC1∷LUC+ (n=60) rhythms after mock (grey), 0.2mM SA (blue) or 1mM SA (red) transient treatments indicated in (A) and Figure S2D.
(G-I) Period (G), phase shift (H) and normalized amplitude (ratio over mean mock) (I) values of CCA1∷LUC+ rhythms after mock (black) or 1mM SA (red) transient treatments performed at different times of the day. Plants were grown as indicated in (A) and treatments were started at 6 different times during the second day in LL (ZT24, ZT28, ZT32, ZT36, ZT40, ZT44). Results represent mean values [± SEM, n=48] of 4 independent experiments.
Statistical analyses between mock and SA treated plants were performed using the t test (B, C, D and F) and Watson-Williams test (E). Stars indicate the level of significance (*p<0.01, **p<0.001, ***p<0.0001).

