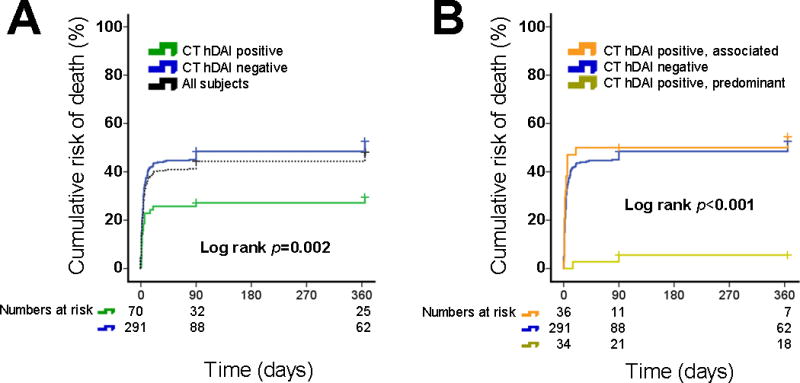
Figure 2. Survival analysis for the one-year risk of death stratified by CT-hDAI status.

Shown are the Kaplan-Meier curves for the 1-year cumulative risk of death stratified by (A) absence vs. presence of CT-hDAI, and (B) CT-hDAI phenotype. Dotted line in panel A indicates the cumulative absolute risk of death in all included subjects (n=361) for reference only.
