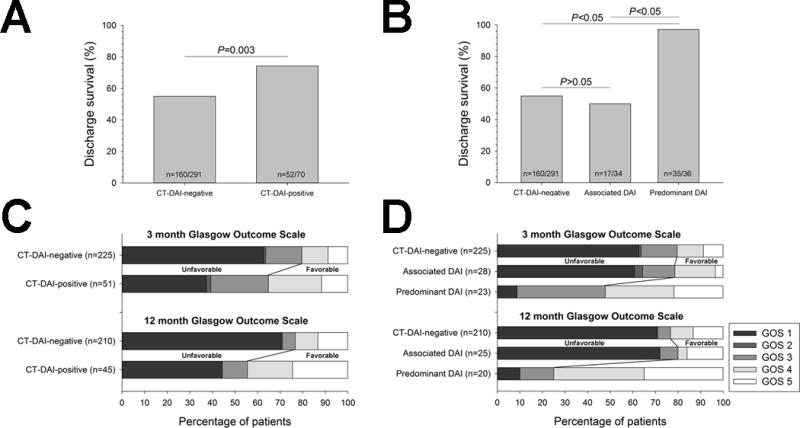
Figure 3. Outcomes stratified by CT-defined DAI status.

Proportion of patients with (A) discharge survival as well as (B) Glasgow Outcome Scale (GOS) distribution at respective 3- and 12-months stratified by absence versus presence of CT-defined hDAI in the primary analyses. Secondary analyses of the (C) discharge survival and (D) GOS distribution at respective 3- and 12-month outcomes further stratified by hDAI phenotype. Statistical comparisons of in-hospital survival were performed with χ2-test with post-hoc Bonferroni correction.
