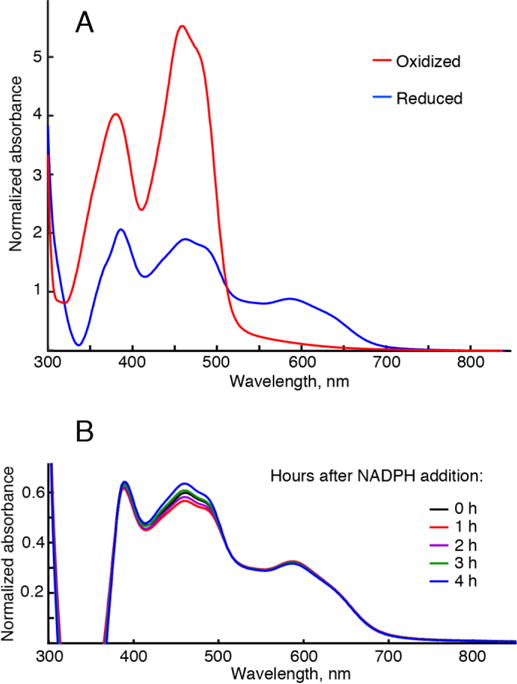
Figure 3.

UV-visible absorbance spectra of the POR flavins. (A) Representative spectra of Q157C/Q517C Δ56 POR labeled with 13C-MMTS oxidized with ferricyanide, red trace, and reduced with excess NADPH, blue-trace. Vertical axis is an absorbance normalized by the protein concentration. Reduced trace (blue) is distorted in the wavelength range shorter than 400 nm due to incomplete compensation of the NADPH absorbance by a reference NADPH solution. (B) The time evolution of absorbance in a typical NMR sample reduced with NADPH. The sample was prepared the same way as if making a POR sample for NMR, but it was sealed in the optical cell instead of a Shigemi tube to allow for the repeated absorbance measurements. Consecutive recordings of absorption spectra were taken at fixed time intervals given in the figure.
