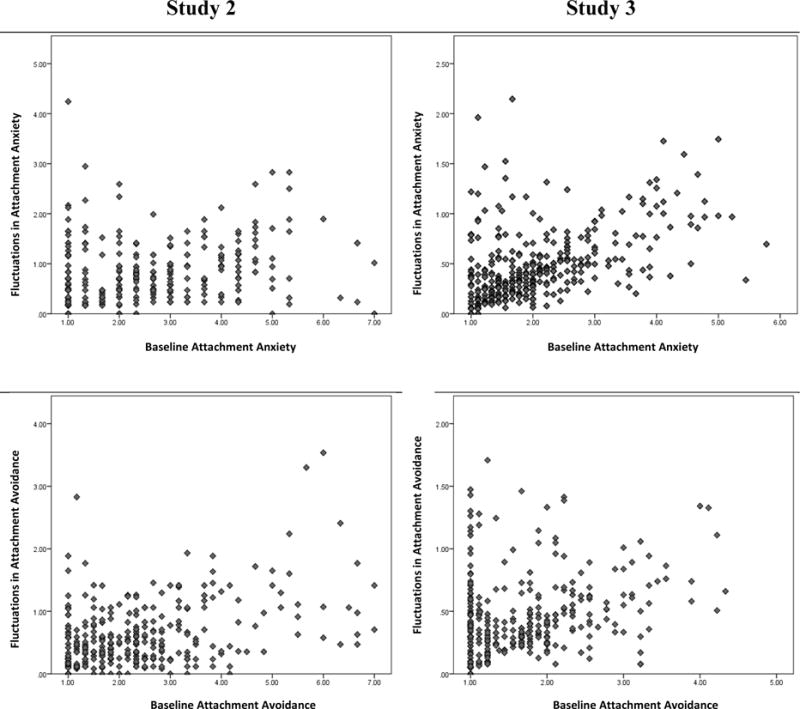
Figure 1.

Scatterplots of (a) individuals’ baseline relationship-specific attachment anxiety and fluctuations in relationship-specific attachment anxiety (top row), and (b) individuals’ baseline relationship-specific attachment avoidance and fluctuations in relationship-specific attachment avoidance (bottom row) in Studies 2 and 3.
